KDJ Indicator MT4
Platform: MT4 Type: Oscillator Last update: April 19, 2025The KDJ Indicator for MT4 represents an enhanced approach to the traditional stochastic oscillator. Namely, it adds a third dimension to price analysis. This results in ability to expose hidden momentum shifts. The secret lies in the right interpretation of relationship between three lines to detect early trend reversals and continuations.
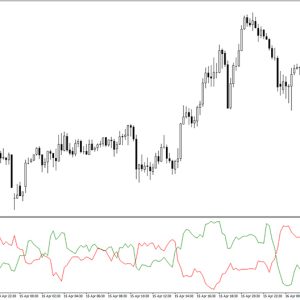
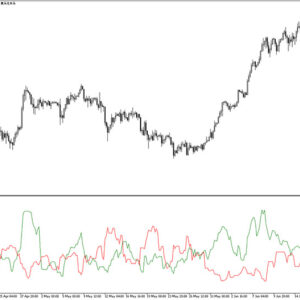
Example chart:

KDJ vs standard stochastics
The standard stochastic uses K and D lines to identify momentum and potential reversals. KDJ takes a step forward and onboards the J line, which strengthens the difference between K and D values. This makes potential market turns more visible before they fully develop.
Traders can consider J line as an early warning sign. It usually moves in more dramatical manner than the K and D lines, often highlighting potential reversals before they become obvious to the naked eye.
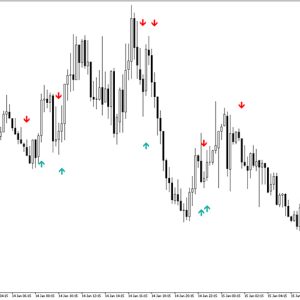
How to trade with the KDJ indicator for mt4?
The KDJ indicator generates two types of signals, as described in the table below.
| Oversold conditions (buy signal) | Overbought conditions (sell signal) |
|---|---|
When the J line (green one) crosses below both the K and D lines, it indicates extreme selling pressure that can be running out of fuel. This pattern suggests a potential bullish reversal and this is a good moment to:
|
Conversely, when the J line crosses above both K and D lines, it signals heavy buying is getting exhausted. This setup often precedes bearish reversals, presenting good opportunities to:
|

Tips to increase performance of the KDJ indicator
Here are couple of tips to maximize the KDJ indicator’s effectiveness:
- Confirm signals with price action – candlestick patterns allow to double confirm the readings
- Use support/resistance levels – this helps to identify high-probability entry and exit points
- Consider trend direction – KDJ signals that align with the broader trend tend are simply more reliable
- Apply moving averages – often filter out less promising signals
Conclusion
The KDJ indicator for MetaTrader 4 should be rather used as a confirmation tool. For example, imagine price approaches an important support level while KDJ shows an oversold condition with the J line located below K and D line. Combined signals increase the sucess probability and provide strong validation for a long entry.