Double Stochastic With RSI Indicator
Platform: MT5 Type: Oscillator Last update: October 17, 2024The Double Stochastic With RSI Indicator for MT5 is an interesting combination of these two popular oscillators that are by many considered the best reversal gauges. Its main principle is comparing previous and current values of the readings. The final calculations are pleasantly displayed on the charts with clear overbought and oversold areas.
The idea behind this indicator
Both of the core components were designed to detect market extremes. In fact, the Stochastic seems to be more sensitive than the RSI. Momentum traders usually think which is better one and which one to choose. The dillema was solved by creating this indicator that laverages the best parts of them into single tool.
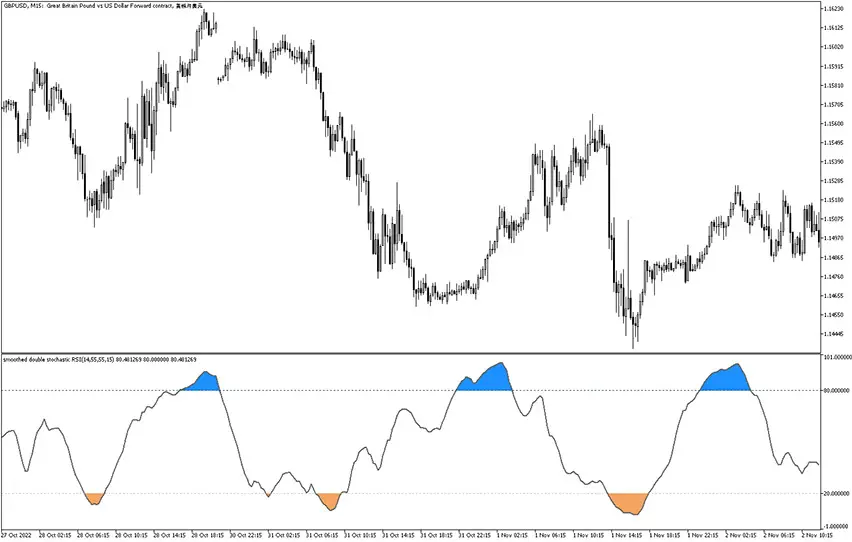
As the result achieved, you can just take a look at this example chart.
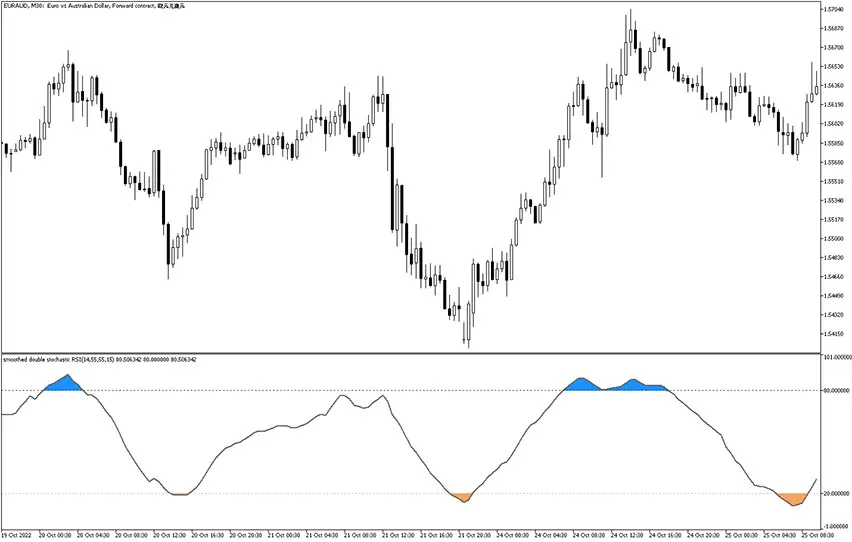
As you can see, it’s displayed within dedicated window. It has, typically for oscillators, a two dashed horizontal lines defining overbought and oversold levels. An orange region below 20 points too much selling pressure and potential price correction to the upwards will occur. Similarly, a blue area above 80 suggests exhausting buying pressure and downwards reversal may take place.
When to enter and exit?
When the oscillator line reaches an extreme zone, it gets specifically colorized. An entry is triggered when the line leaves this zone and it should be additionally confirmed at least with price action pattern or other technical analysis tools. As the take profit target you can opt for the opposite extreme area.
Performance observations
We rate this this tool as a pretty effective mean reversal indicator. While the accuracy is not always great, if it repeats given signal, the probability of the actual reversal rises significantly. What’s more, the signals tend to be rather short and mid term trend rather than quick impulses. Another advantage worth to note is that these signals are non-repainting.
Submit your review | |