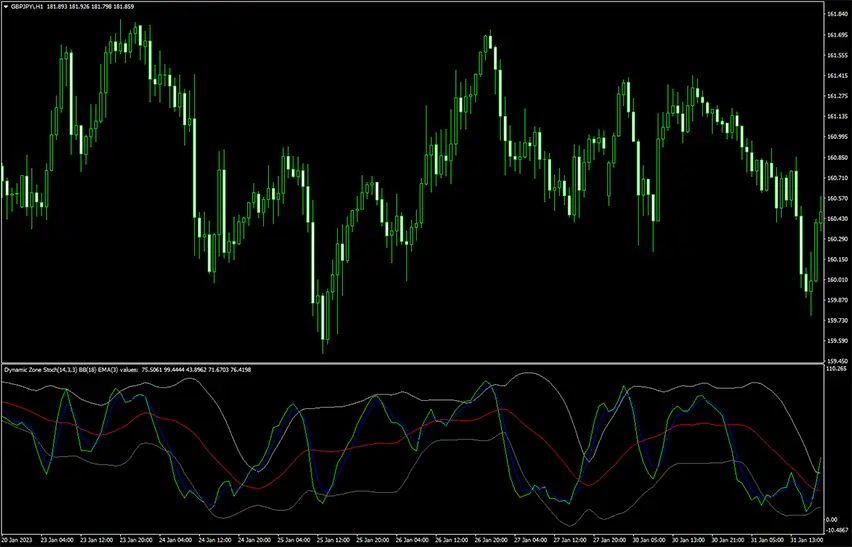
Dynamic Zone Stochastic Indicator
Platform: MT4 Type: Oscillator Last update: September 21, 2024The Dynamic Zone Stochastic Indicator for MT4 is an unqiue variation, because it displays oscillator within a colored channel. There are not many similar gauges that use this appraoch, so can be considered pretty special. But what about the performance since that aspect is most important. Let’s find out.
Anatomy of the dynamic zone stochastic
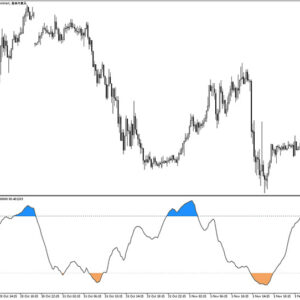
First of all, it plotts an oscillator line fluctuacting between levels of 0 and 100. What’s more, it highlights specific areas where a currency pair is considered overbought or oversold. Comparing the traditional relative strenght index, these zones are not fixed but essentially adaptive. The idea behind this is generation of potentially the best trade entry points.
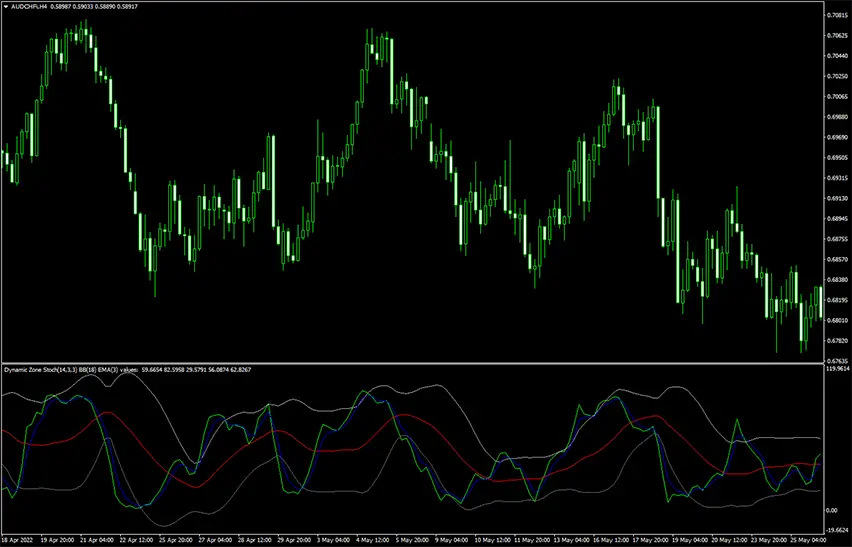
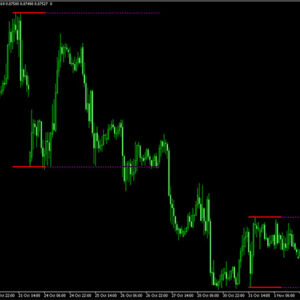
As you can see, touches of bands correspond to price reversals very closely. This is a solid accuracy.
How is this build?
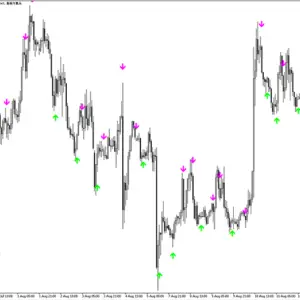
When you take a closer look, you’ll see %K line (green) and %D (blue). Their crossovers signal bullish and bearish momentum. When they exceed limits defined by the channel, it’s a trigger potiential reversal and according trade. Obviously, buy at the bottom and sell at the top.
While it’s efficiency is relatively high, it can be succesfully paired with other technical analysis tools without any problems. For example, you can use it just for entries, but find out overall trend with moving averages or observe price action reactions at support/resistence levels.
Summary
We think this is a very good forex indicator which provides high-probability reversal setups. In fact, it can be applied to various strategies, but can be used standalone as well. It’s handy for scalpers, swing traders and day traders depending on selected time frame.