Full Stochastic Indicator
Platform: MT4 Type: Oscillator Last update: December 15, 2024The Full Stochastic Indicator for MT4 is a trading tool that was created for identyfing potential short-term swing positions and providing signals based on bullish and bearish trend momentum. The concepts applied here rely on crossover of stochastic lines and overbought/oversold market conditions. We can say it’s an enhacement of similar oscillators and let’s see what makes it stands out.
Example chart
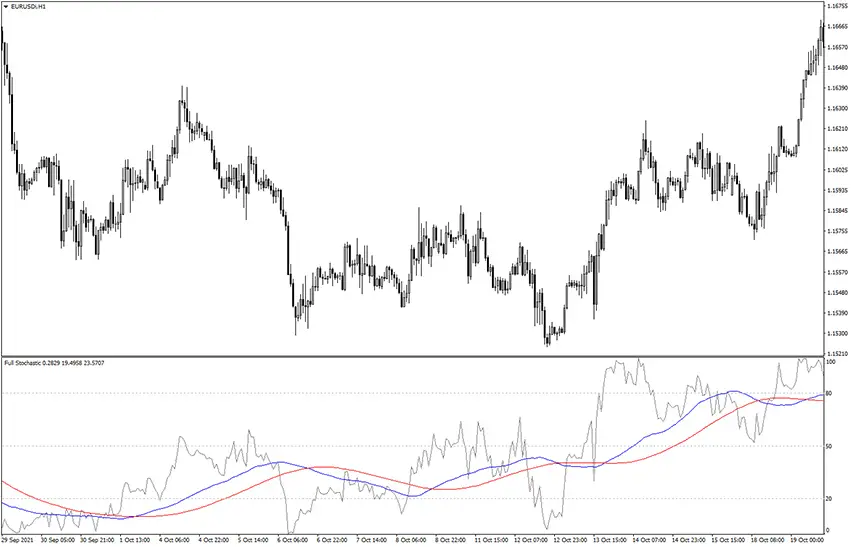
When you activate it in your MetaTrader platform, the view should resamble the chart below.

As you can see, there are basically a three lines: blue, red and gray.
The gray one is called Slow K-line and you should pay attention whether it is above 80 level or below 20 level. When such setup is in place it means the buying or selling pressure is exhausting and likely there is reversal upcoming soon. The other are K-Line (blue) and D-Line (red) and aspect to observe it their alignment, i.e. blue over red suggests bullish momentum, while reversed scenario indicates bearish bias.
How to trade with full stochastic indicator for mt4?
One of its advantages is the fact that comparing to alternatives its more steady during periods of increased volatility. In other words, it’s more reliable when price is making a choppy and sideways moves. It also do a great job detecting larger market swings which may result in highly profitable trades. Let’s bring some practical examples.
Long trade
For a buy opportunity, look for a bullish crossover between the K and D lines. Additionally, confirm it by drop of slow K Line below 20, which is considered an oversold zone. You can validate it futher by price action like rejection at support. Keep trade open and ride trend until reach of opposite zone above 80 or bearish crossover. This chart shows exactly described scenario.

Short trade
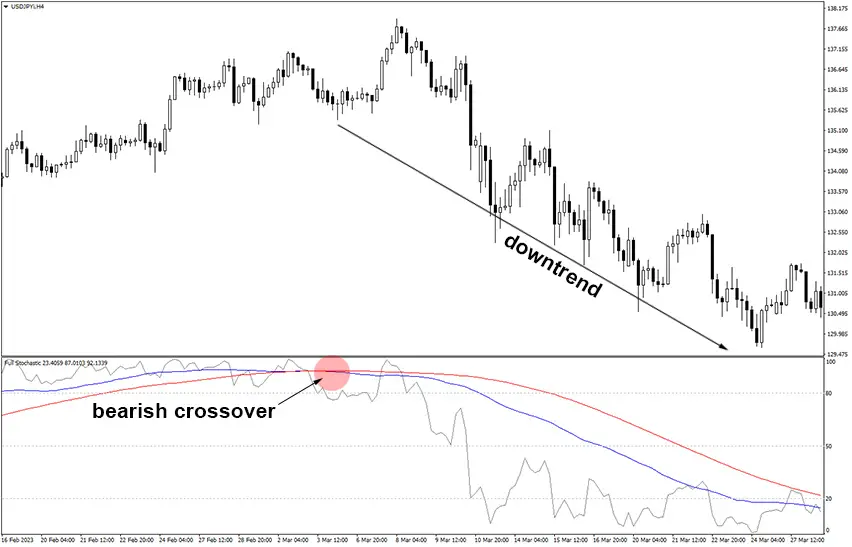
When search for a sell trade, it’s good to begin with spoting a bearish intersection of the K and D lines. As next step, patiently await for slow gray Line to rise above 80, indicating an overbought state. Account a price action signals that confirms a bearish rejection at resistance level. Similarly, take profit when reversed setup occurs.
Conclusion
We think there is a real added values offered by this indicator. It has pretty solid and conistent signals that proved to be working in various conditions. The full stochastic stands a great foundation and forex traders can combine it with other technical analysis tools to build highly effective strategies.
Submit your review | |