ADR Indicator MT5
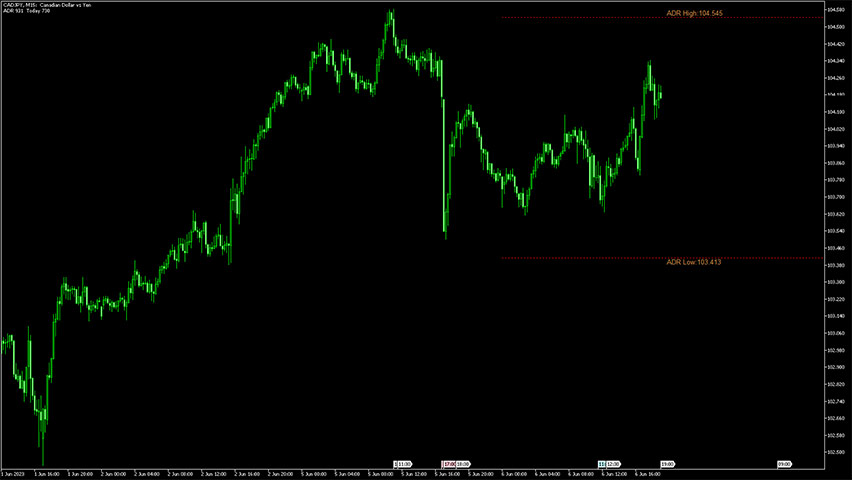
Platform: MT5 Type: Market Levels Last update: July 25, 2026The ADR (Average Daily Range) Indicator for MT5 calculates the expected daily price range and plots it directly on your chart.
Think of these boundaries as support and resistance levels, useful reference points for spotting breakout and trend reversal opportunities.
Example chart:
How to use the ADR Indicator for MetaTrader 5?
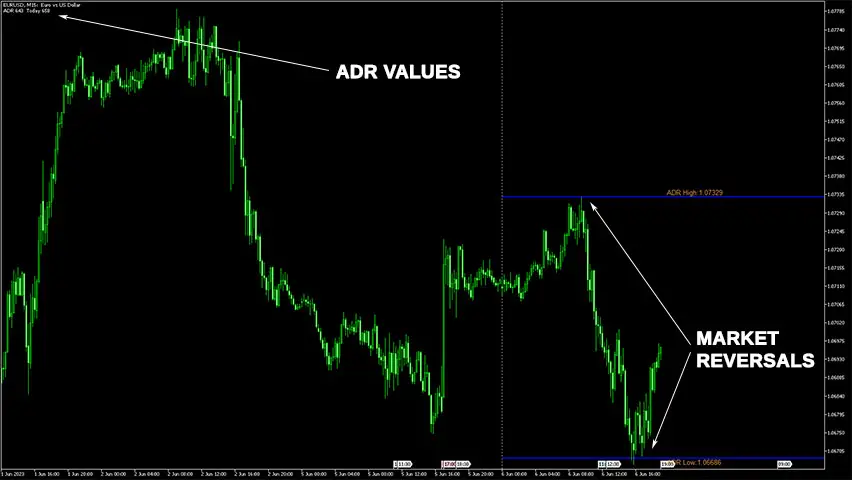
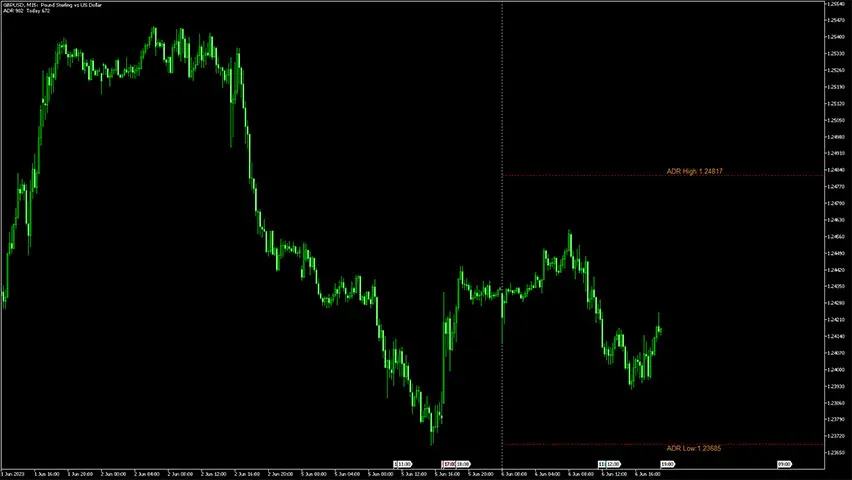
The indicator tracks the current day’s range and displays the data in different parts of your chart. You’ll find the value in the top left corner, while horizontal lines mark the range as the day progresses.
This gauge is based on past data (14 previous periods by default) and adjusts automatically to volatility, so some days show a wider range and others stay tighter. Each currency pair also has its own volatility tendencies, so it’s worth checking them individually.
How to read the bands?
Watch price action near the high and low bands. These zones typically show shifts in volume and momentum, leading to either a rejection and reversal, or a breakout and trend continuation.
Pick one strategy and master it, then add other technical tools to confirm your decisions if needed. Statistically, price tends to exhaust near support and resistance zones, which is why many traders favor the reversal approach.
When price hits the top ADR line, watch for a short (sell) setup. When it hits the bottom line, watch for a long (buy) setup. Place your stop loss a few pips from the trigger line, with take profit targets at the middle of the range or the opposite side.
Conclusion
The ADR Indicator for MT5 gives a realistic picture of the day’s likely range, which makes planning entries, targets and risk far more grounded than guessing.
Feel free to pair it with another technical analysis tool of your choice to sharpen your edge further.