TD Sequential Indicator MT4
Platform: MT4 Type: Pattern Last update: May 3, 2025Knowing potential market trend reversals before they occur is the holy grail for traders. There is a tool called the TD Sequential Indicator for MT4 and it was developed by famous technical analysis pioneer Tom DeMark. It gives traders this edge as it’s able to identify reversals with high accurarcy and probability.
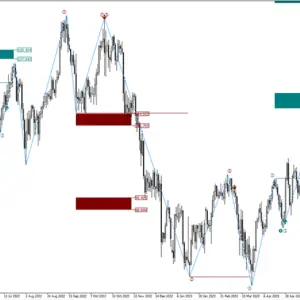
Example chart:

Concept behind the TD Sequential Indicator
The TD Sequential Indicator is built around the idea of trend exhaustion.
Most of conventional indicators rely on lagging mathematical formulas. This one, however, works by measuring market exhaustion through a counting mechanism. This approach allows traders to anticipate reversals rather than just react to them after they’ve already begun.
Experienced traders know that markets move in waves and extended price movements in one direction often create conditions ripe for reversals. The indicator takes advantage of such setup.
Understanding the counting mechanism
The TD Sequential puts labels above and below candles with numbers in a specific sequence based on price fluctuactions:
- In Uptrends: Blue numbers appear above candles, marking a progression toward potential trend exhaustion
- In Downtrends: Red numbers appear below candles, signaling developing bearish exhaustion
The candles are numbered from 1 up to 13, where 9 acts as a warning signal.
How to trade with the TD Sequential Indicator for MT4?
When using the indicator, it’s important to understand two phases – setup and countdown.
- Setup (1-9): this begins when the price closes higher (in an uptrend) or lower (in a downtrend) than the close of four bars earlier. It continues for nine consecutive candles.
- Countdown (1-13): once the setup completes, the indicator looks for 13 bars where each bar closes higher/lower than two bars earlier, depending on trend direction.
Spotting an reversal
For a bearish scenario, there should be an clear uptrend, and traders should watch for candles 8 and 9 to close above the highs of candles 6 and 7. This indicates that buyers may be exhausted. When a strong bearish candle 1 forms immediately after, it’s a potential short entry.
Similary, for a bullish setup there needs to be a downtrend and traders need to look for candles 8 and 9 to close below the lows of candles 6 and 7. This means a weakening selling pressure. A large bullish candle 1 is your potential buy trigger.

Additional tips
A countdown to 13 adds further confirmation. If price continues beyond candle 9 and reaches the 13th count, the reversal signal becomes stronger. This phase helps confirm that price exhaustion is not just temporary noise.
In order to improve success rate even more, it’s a good idea to use in confluence with support/resistance levels: A TD 9 or 13 signal near a key level strengthens the reversal case.
Conclusion
The TD Sequential indicator for MetaTrader 4 is not about predicting every price move. Realistically, it helps recognize when a trend is losing strength. Traders receive points to enter counter-trend trades or trend continuation on pullbacks or even exit trend-following positions.