MACD on RSI Indicator MT4
Platform: MT4 Type: Momentum Last update: July 25, 2026The MACD on RSI Indicator combines MACD and RSI to identify trend direction, using the strengths of both to generate more reliable signals.
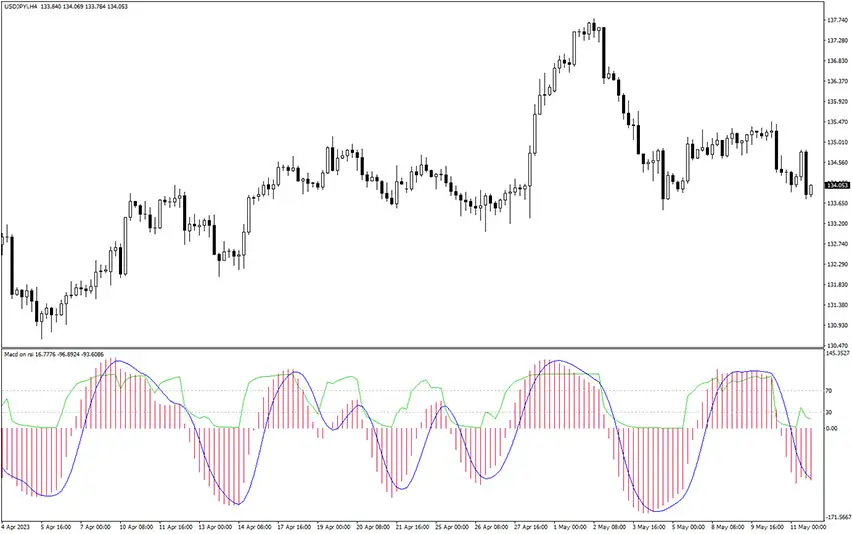
Example chart:

How to use the MACD on RSI Indicator for MT4?
The indicator uses three moving averages: a fast EMA (green line), a slow EMA (blue line), and a signal SMA. It also includes a 5-period general MA.
Unlike traditional MACD, which plots a histogram below the chart, MACD on RSI uses bars to show trend direction while adding RSI’s ability to spot overbought and oversold conditions. Like standard RSI, a reading above 70 signals overbought and 30 or below signals oversold.
As a momentum indicator, it oscillates between set levels. It works well across timeframes, but tends to perform better on bigger ones.
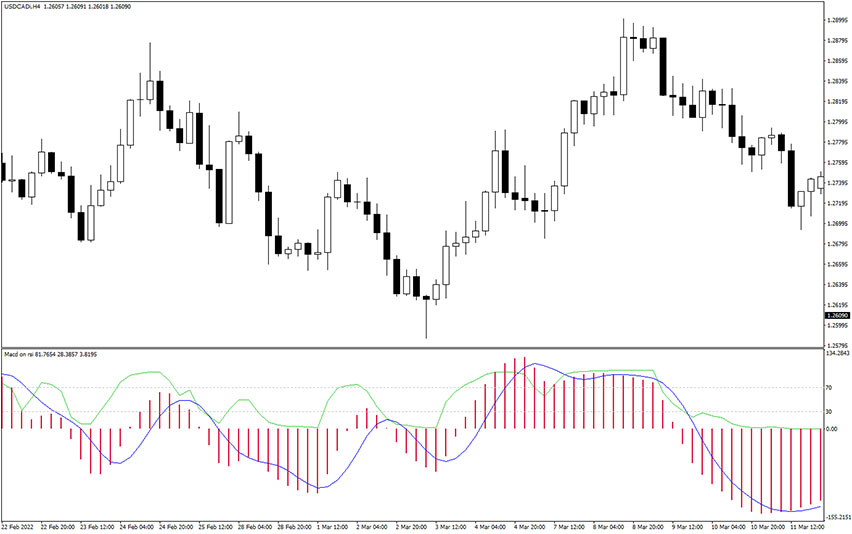
Take a look at the USD/CAD H4 chart below.
When to open a position?
To enter a long position, look for two conditions. Namely, the bars show oversold territory and the fast EMA sits below the slow EMA.
Sometimes both conditions line up but price moves the other way, usually in choppy or ranging markets. Wait for price action to confirm upward momentum before entering.
To enter a short position, look for the opposite: the bars show overbought territory and the slow EMA sits below the fast EMA.
Same rule applies here. If price doesn’t follow through, wait for price action to confirm downward momentum before entering.
Summary
The strength of MACD on RSI Indicator for MetaTrader 4 is in what it filters out: by requiring both an EMA crossover and an overbought/oversold reading to align, it cuts down on signals that look valid but aren’t.
It won’t eliminate false signals entirely, especially in ranging markets, but combined with price action confirmation, it gives traders a solid way to time entries and exits.