FTLM STLM Indicator MT5
Platform: MT5 Type: Momentum Last update: April 21, 2025The FTLM STLM Indicator for MT5 is responsible for performing advanced momentum analysis. It applies digital filters to smooth price movements and in the result, it’s able to identify clear and reliable entry and exit points. In other words, it filters market noise and detect potential market reversals with high probability.
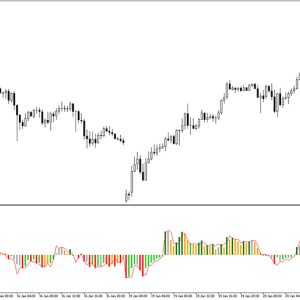
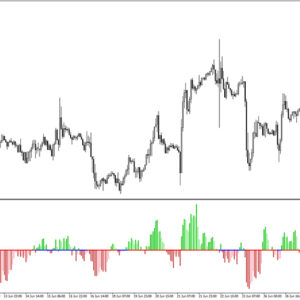
Example chart:

How the FTLM STLM indicator for MT5 works
The indicator consists of two core components:
- Fast Trend Line Momentum (FTLM): processes close prices through digital filters rather than using just raw price data. This gives smoother readings compared to classic momentum indicators. Als, this element responds quickly to price changes, capturing short-term momentum shifts.
- Slow Trend Line Momentum (STLM): acts as a baseline against which to measure the faster component’s movement. It uses a longer period in order to calculate the trend direction.
Trading signals of the FTLM STLM indicator
The long entry is valid when FTLM crosses above STLM. This means increasing upward momentum. At the same time, the histogram bars should turn blue. When both lines cross above the zero level, this further validates bullish conditions.
For short entries, look for FTLM crossing below STLM with red histogram bars confirming downward momentum. The strongest bearish signals occur when both lines drop below the zero level. This validates the negative market sentiment.

Possible strategies
The are multiple cases for using this indicator, including:
- Trend confirmation – consider trades only when FTLM and STLM align with the dominant trend direction.
- Divergence signals – look for price making higher highs while FTLM makes lower highs (bearish divergence) or the opposite (bullish divergence).
- Histogram reversals – a shift from red to blue (or vice versa) can act as an early trend reversal alert.
Bottom line
The FTLM STLM Indicator for MetaTrader 5 was designed to minimize market noise and help traders to understand differencies between temporary pullbacks and actual trend changes. It works well on multiple timeframes, however the 1-hour and 4-hour charts can be considered a sweet spot as they provide the best balance between signal frequency and reliability.