Linear Regression Channel Indicator MT5
Platform: MT5 Type: Channel Last update: August 16, 2026The Linear Regression Channel Indicator for MT5 plots five sloped lines that together form a channel, calculated from the maximum price deviation over a set period.
The outer lines mark the channel’s boundaries and act as support and resistance, while the slope of the channel shows the overall trend direction.
By default, the indicator looks back 150 bars from the most recent candle, though this period is adjustable.
Example chart:

How to use the Linear Regression Channel Indicator for MT5?
Start by checking the slope of the Linear Regression Channel to confirm whether the trend is clearly upward or downward.
Watch closely when price approaches the outer red dotted bands, these are zones with a high probability of a reversal.
As a general rule, only look for short trades when candles sit above the blue centerline and only long trades when they sit below it. Price tends to revert back to the blue line after touching a band, which makes it a solid take-profit target.
Occasionally, price will break outside the channel entirely. When this happens, it can signal the start of a new trend.
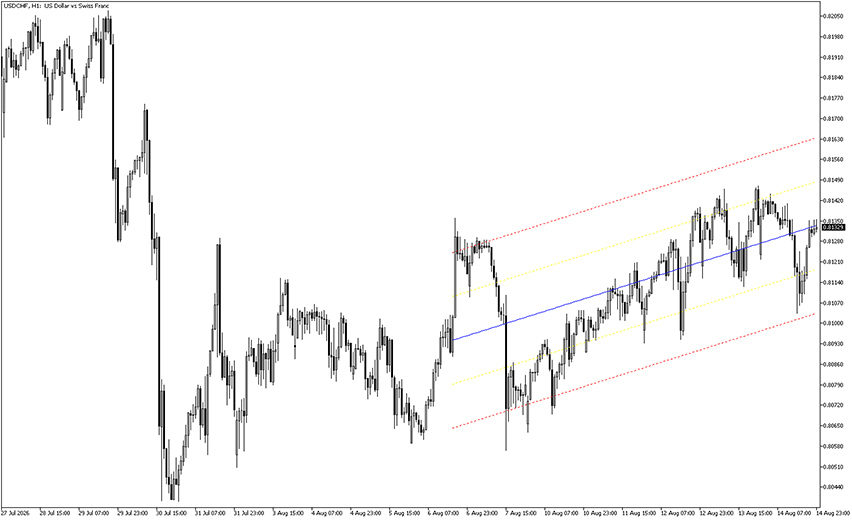
As you can see on the USD/CHF H1 chart, price stays contained within the red outer bands for most of the move, respecting the channel’s upward slope throughout.
Several touches of the lower red band are followed by a bounce back toward the blue centerline, confirming it as a reliable take-profit zone.
Near the right edge of the chart, price pushes above the blue line and starts consolidating below the upper band, a spot worth watching for either a continuation or an early sign of a slope change.