ABL Indicator
Platform: MT4 Type: Channel Last update: April 20, 2026The ABL Indicator for MT4 was designed to project potential price ranges using probability-based methods. In other words, it takes a mathematical approach to estimating where price is likely to move.
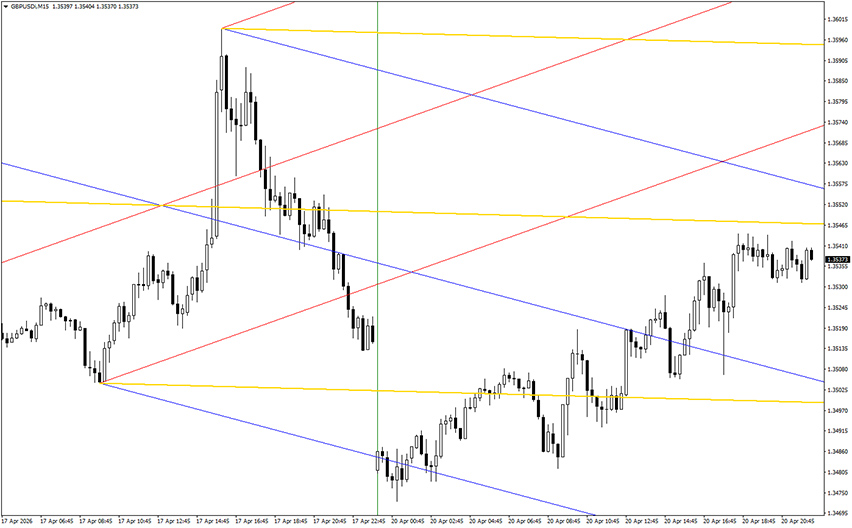
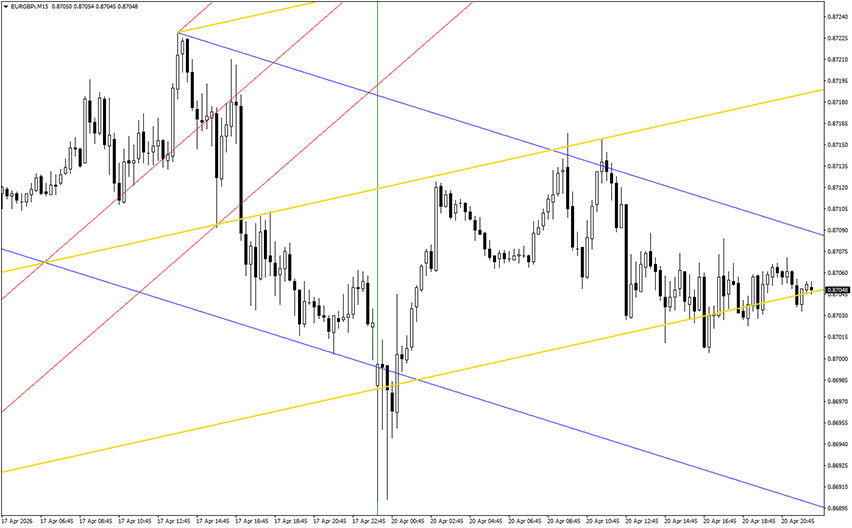
Example chart:
How to use the ABL Indicator?
The ABL indicator looks at past days and identifies key price points, specifically the extremes.
It then applies a series of mathematical transformations (including pi and exponential factors). These calculations produce an “area” which is then broken down into projected ranges.
In the end, these ranges are aligned with the start of the current trading day to estimate where price is most likely to move.
On the chart, this shows up as structured zones or channels. They act as expectation ranges and traders should consider them as possible price movement throughout the day.