Category: Momentum Indicators
Jurik Smooth Histogram MTF Indicator
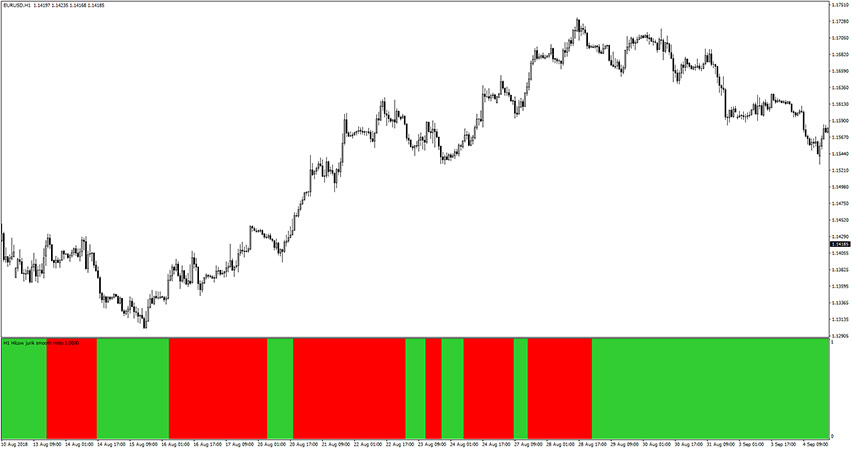
The Jurik Smooth Histogram MTF Indicator for MT4 is a simple forex trend oscillator that helps to understand the current market momentum and notifies you of possible changes in the market trends. It uses histogram bars to display its trade signals. The developer of the Jurik Smooth Histogram placed emphasis on both the simplicity and […]
CAM Indicator for Trends and Counter Trends
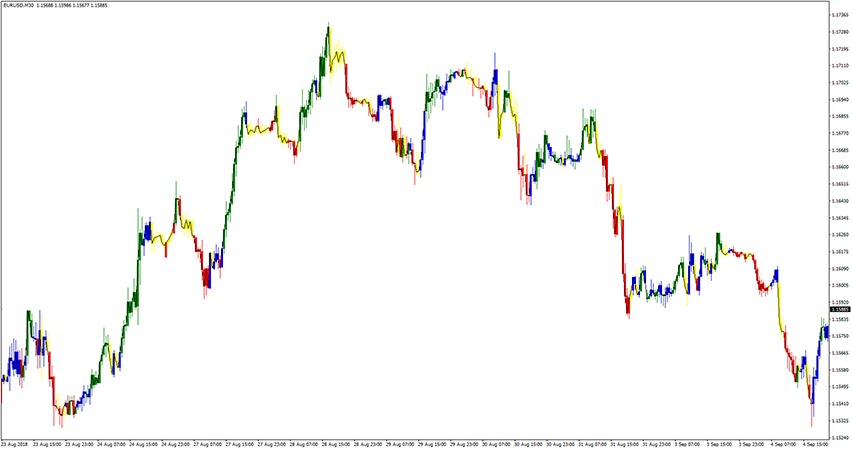
The CAM Indicator for Trends and Counter Trends overlaps colorful candlestick on the main trading chart. Green bars represent a bullish trend, red bars represent a bearish trend, blue and yellow bars shows trend change or market indecision. See also: DDFX Major Trend Indicator MACD Candles V3 Indicator
Profitunity Bars Indicator
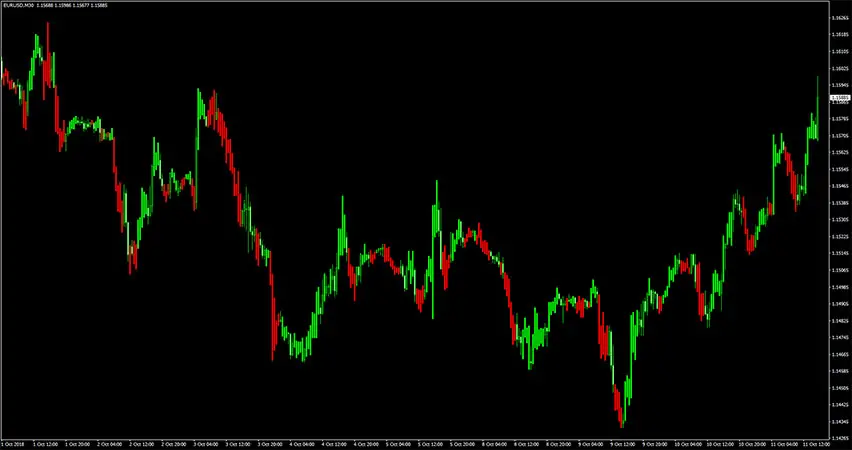
The Profitunity Bars indicator uses a custom formula to calculate trend momentum for each candlestick and colorizes these bars accordingly. When the candlesticks are colored green, it means that the current short time period trend is bullish. Similarly, when the candlesticks are colored red, it means that the current short time period trend is bearish. […]
Profit Master V3 Indicator
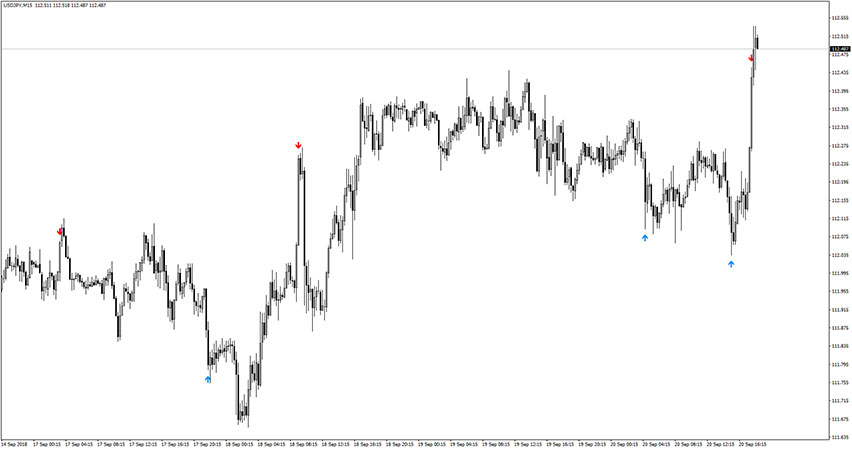
The Profit Master V3 indicator for MT4 is a custom forex indicator that displays buy/sell arrows. When the upward arrow appears it means a possibility of market trend momentum will turn bullish. When the downward arrow appears it means a possibility of market trend momentum will turn bearish. These arrows do not indicate accurate forex […]
Zone Trade Indicator
The Zone Trade is a forex indicator that uses momentum, acceleration and price confirmation for the color of candles. This approach of trading was first mentioned by Bill Williams and he calls it trading in the zone. There are three types of trade zones: Buy Zone – a candle is green and you can go […]
Three Moving Averages Convergence/Divergence (MAxCD) Indicator
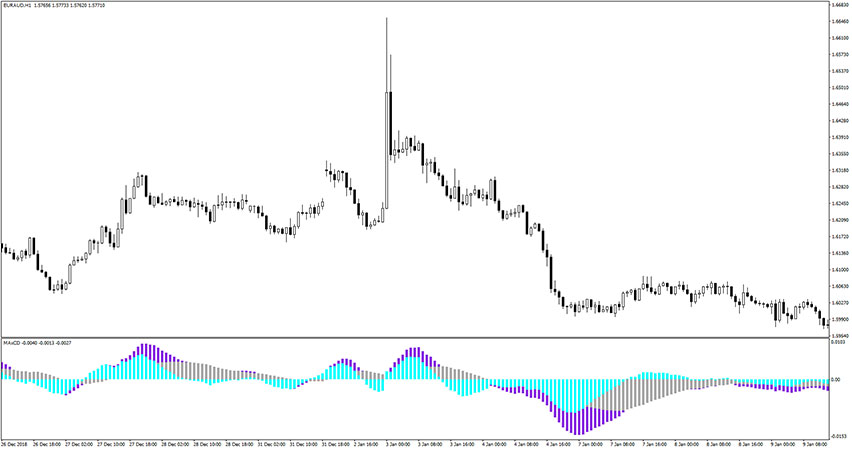
The Three Moving Averages Convergence/Divergence (MAxCD) indicator also known as MAxCD, is a signal oscillator that consists of three moving averages. This forex indicator draws three colored histogram bars that float above and below the zero level. Each color of the histogram bar represents each moving average. The readings of that gauge are really easy […]
AFI MACD Indicator
The AFI MACD indicator is just another variation of the Moving Average Convergence Divergence gauge. The composition of this tool is pretty standard. There are blue histogram bars fluctuacting between positive and negative values. Two moving averages are just corresponding to these bars and both readings are aligned. Example chart:
FX Pip Power Indicator
Introduction to the FX Pip Power Forex Indicator The FX Pip Power Forex indicator works in a similar manner to the Moving Average Convergence Divergence (MACD) gauge. It measures the strength and direction of the market trend. When the bars are green and above the 0 level, you should be looking for buy opportunities. Similarly, […]
Laguerre Histogram Indicator
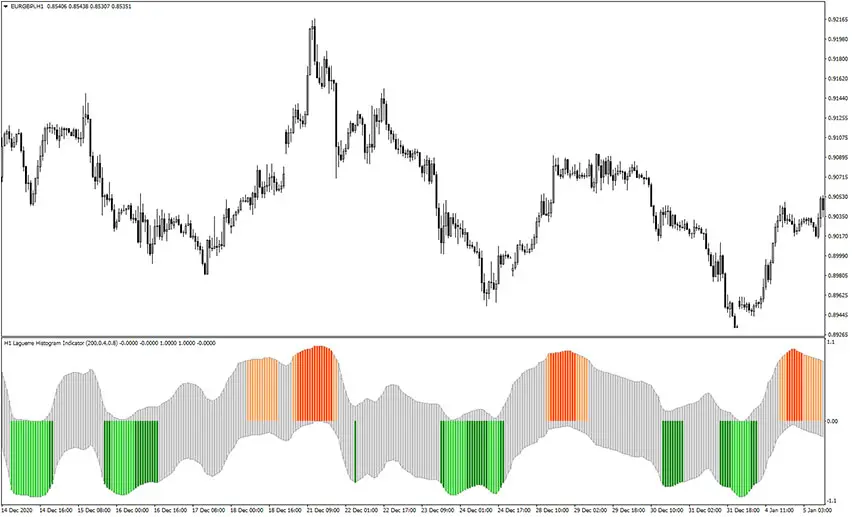
The Laguerre Histogram indicator, as the name suggests, displays Laguerre Oscillator signals in a form of the histogram bars, but also in an unusual way. These histogram bars are plotted into some kind of channel. Generally speaking, green bars represent an oversold market state and opportunity for a long trade (buy). Similarly, red bars represent […]
ATR Multi Time Frame Indicator

The ATR Multi Time Frame indicator is a custom forex trading indicator that displays rising and falling histogram bars. This is the multi-timeframe tool. It means you can choose if you want to receive signals from the current timeframe or higher. For example, you can use hourly TF for entries, but use daily TF for […]