Category: Forex MT5 Indicators
Linear Regression Sketcher Indicator MT5
The Linear Regression Sketcher Indicator for MT5 is an enhanced version of this tool with main difference being the inclusion of additional lines. They are provided on charts in order to reflect direction at a specific time and price. In the results, forex traders can use both the regression final output and its rate of […]
Perfect Trend Line 2 Indicator
The Perfect Trend Line 2 Indicator is a variation of a popular “Perfect Trend Line Indicator”. This version is adding a sort of signals filtering which helps in cleaning up some false signals that take place in the original version. There are two types of signals provided by the Perfect Trend Line indicator. First is […]
Bollinger Bands Stops HMA Based Indicator
The Bollinger Bands Stops HMA Based Indicator displays trend-defining bands placed either below the price or above the price. As the name suggests, that indicator uses Hull Moving Average (HMA) and Bollinger Bands Stops to calculate the signals. When the blue band below the price is placed, it means that the trend-momentum is considered bullish. […]
Dynamic Balance Point Indicator
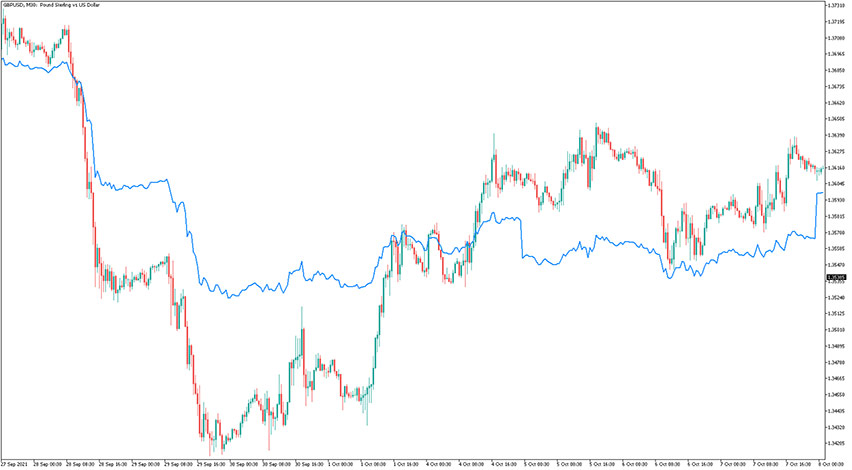
The Dynamic Balance Point Indicator for MetaTrader 5 calculates the dynamic balance point for the desired period. Even though it is a sort of a multi timeframe indicator, it calculates the balance point without the usual issues that multi timeframe indicators have: the recalculation. The balance point is calculated correctly for the current timeframe and […]
MACD Flat Trend Indicator MT5
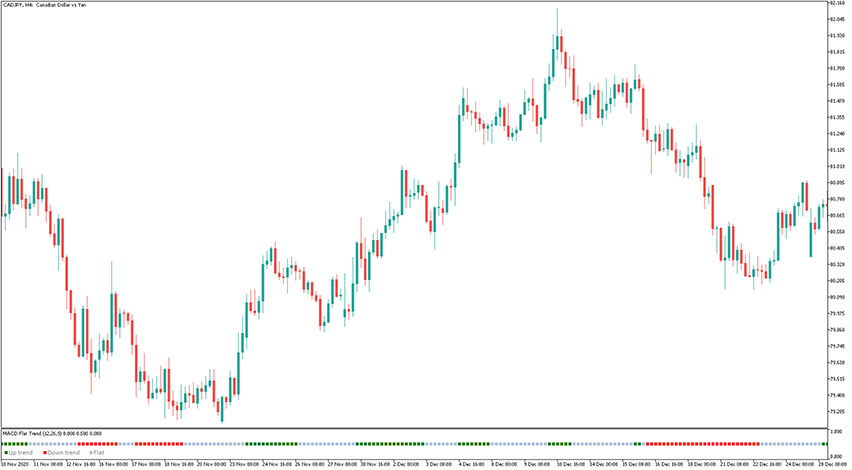
The MACD Flat Trend Indicator for MT5 helps to recognize whenever the market is in an uptrend, downtrend, or being flat (sideways). After this gauge is loaded up, you will see green, red and gray bricks. While the first two colors are pretty obvious, the gray bricks reflect market indecision – in other words, there […]
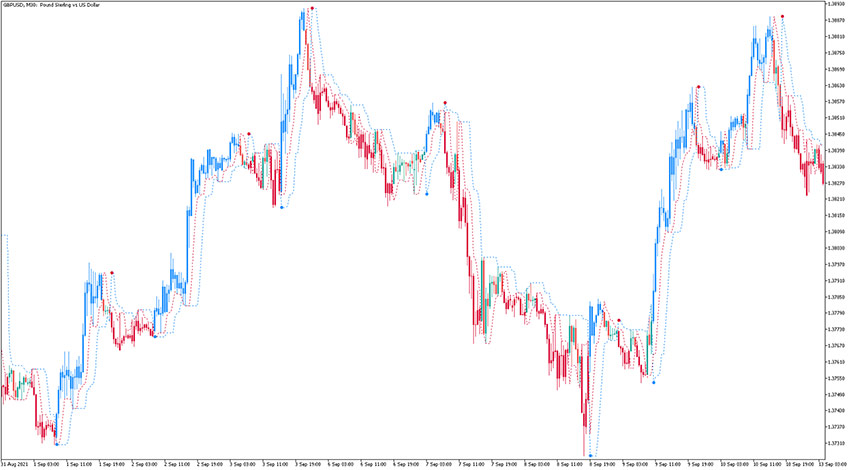
Stochastic of Hull Average Indicator

The Stochastic of Hull Average Indicator is, as the name suggests, a combination of Stochastic Oscillator and Hull indicator. The Hull period is set to 32, and the Stochastic period is also set to 32. As you can see, the signal line is either blue or pink. A blue line indicates bullish trend-momentum, and conversely, […]
Parabolic Weighted Velocity Indicator

The Parabolic Weighted Velocity Indicator works in a very similar manner to the Jurik Velocity. The difference is between Parabolic Weighted Moving Average and Linear Weighted Moving Average. This Parabolic Weighted Velocity extends the original indicator by allowing you to change the “power” of the calculated averages used for velocity calculation. The bigger the Power […]
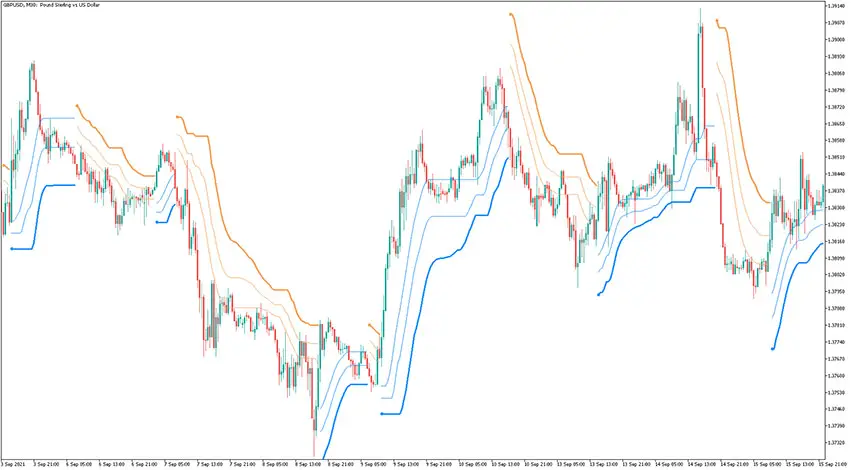
Keltner Channel Smooth ATR Indicator

The Keltner Channel Smooth ATR Indicator for MetaTrader 5 is a volatility-based envelope that is aligned above and below a Moving Average, which is a central element of that indicator. In the settings of that Keltner Channel indicator, you can set the median value average method among the: Exponential Moving Average, Simple Moving Average, Smoothed […]
Blue Renko Bars Indicator

The Blue Renko Bars Indicator displays, as the name suggests, Renko Candlesticks colorized to blue color. The default size of each brick is 10 pips. Remember that Renko Chart works in a different way than standard Japanese Candlesticks Charts. In the case of Renko, the candlesticks are based on the price movement, not on the […]
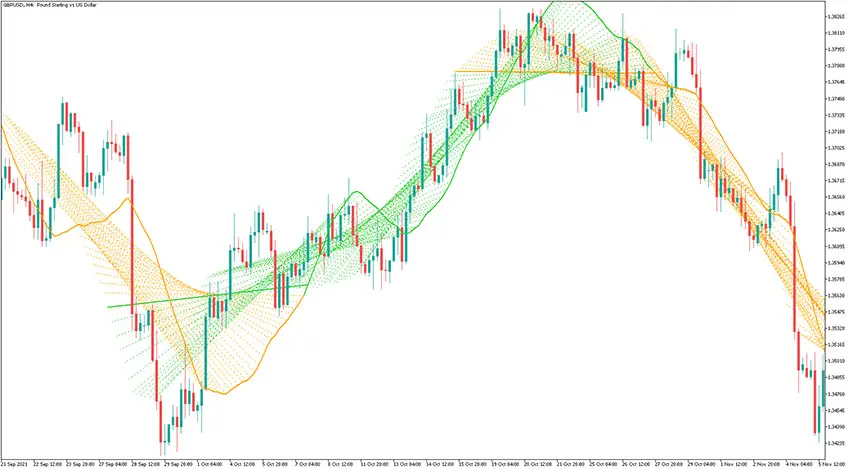
Standard Deviation Channels X3 Cloud Indicator
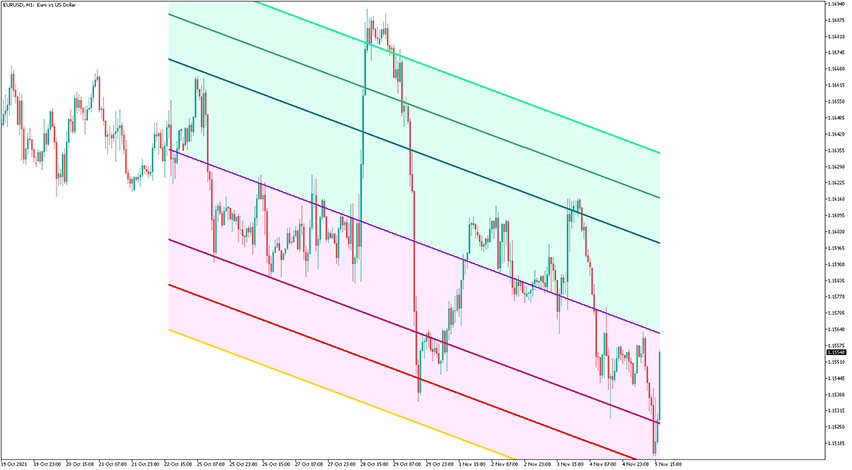
The name of the Standard Deviation Channels X3 Cloud Indicator for MT5 pretty much defines what it is. It plots a channel (with three extensions to top and bottom) based on the Standard Deviation indicator. The violet trendline is a middle line of the channel. First, check the slope of the channel whenever it’s upward […]