Double RSI Trading Signals Indicator MT5
Platform: MT5 Type: Oscillator Last update: June 8, 2025The Double RSI Trading Signals Indicator for MT5, as the name suggests, is based on two Relative Strenght Indexes with various periods. The idea and goal for this combination is providing more accurate trading signals.
Example chart:

How to understand signals provided by the double rsi indicator for mt5?
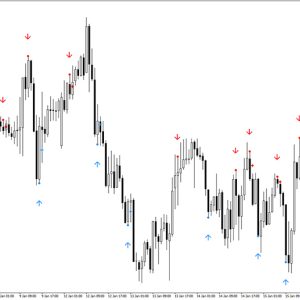
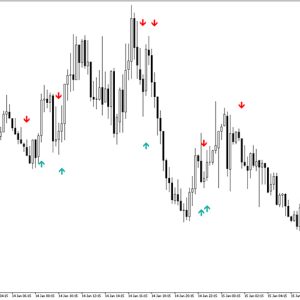
The entries and exits provided by this double rsi indicator are expressed by orange and blue dots. Blue ones are positioned below candlesticks and suggest potential bullish trade. On the other hand, orange ones are placed above bars and correspond to bearish trade opportunity. There is also additional element, an X mark – it appears when a relatively big candle take place (e.g. engulfing bar).
This AUD/JPY H1 chart shows potential buy/sell trades and also X marks.

As you can see, this is a pretty simple approach and should be rather used in conjuction with other technical analysis tools.
Additional note
The indicator may generate multiple signals in the same direction consecutively, so please take that into account. Receiving a signal does not necessarily mean the next one will be in the opposite direction.
Submit your review | |