Fiji Trend Indicator
Platform: MT4 Type: Trend Last update: September 22, 2024The Fiji Trend Indicator for MT4 shines as a popular tool for identifying market trends. It’s really helpful for detecting these underlying trends as well as trend reversals. Forex traders that are familiar with so called Fiji Strategy will recognize this indicator instantly. As always you can download it for free. Fans of buy/sell arrows trading should definitely take a look.
Example chart
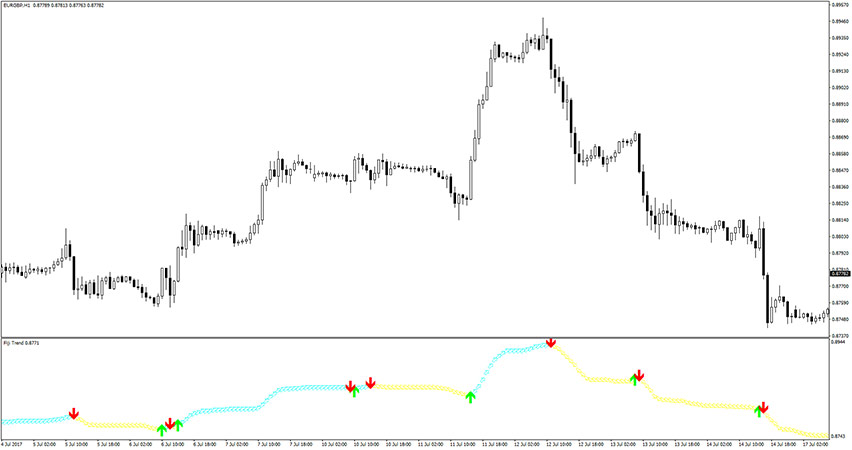
When you activate the indicator in your MT4 platform, the chart should look similar to this:

As you can see in the provided example, it’s displayed in a separate window and consists of the following elements:
- Main signal line – this is a yellow and aqua continuous arrow line
- Entry and exit arrows – these are green and red arrows for buy/sell signals
The indicator utilizes an 11 Average True Range (ATR) and a 5 Moving Average (MA) to generate market signals. It’s most profitable during large market swings. Let’s see how to use the Fiji Trend in practice.
How to apply the Fiji Trend in trading?
General trading rules
Long signal occurs when an green upward arrow appears and the triggering candle has closed. Afterwards, the signal line’s color must turn to aqua. Watch for an opposite arrow to arrive to exit a trade.
Similarly for short signal scenario, a downward arrow must appear along with the signal line’s color switch to yellow. Exit at the appearance of an opposite arrow.
Buy trade example
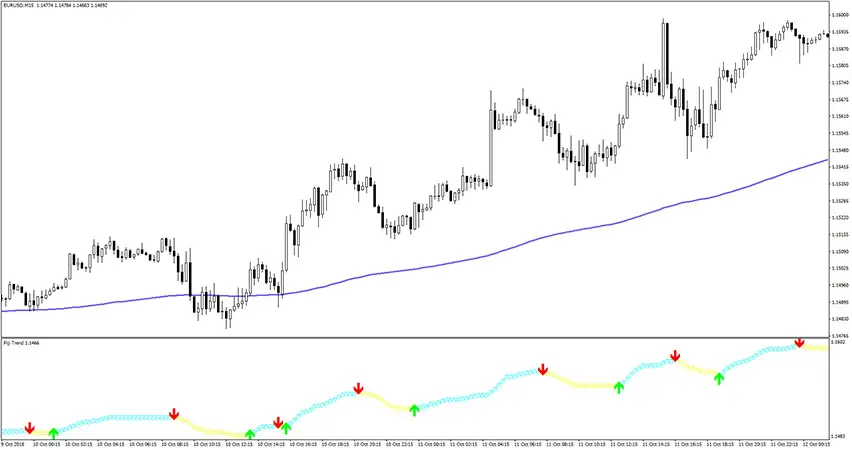
In order to further increase the success rate we have applied the 200-period Exponential Moving Average (EMA). The reason for this choice is to trade only in the direction of the dominant market trend.
First, recognize a clear bullish trend setup – a slope of EMA should be pointing to the upper direction and price level should be higher on the right side comparing to the left side of the chart. Another confirmation is the price being above the moving average line.
As a second step wait for a green arrow to appear. Once it’s in place, you can open a trade and ride a momentum. Don’t forget to put the stop loss sligtly below the EMA line.
For a exit strategy, we suggest to base on the risk-to-reward ratio. You can take profit at 1:2 or even trail your SL and take profit at 1:3.
Sell trade example
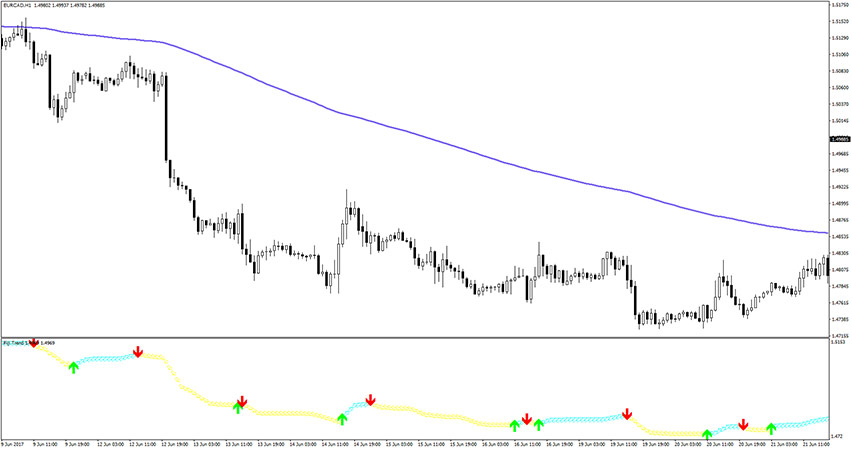
Analogous rules apply to the sell setup. Carefully analyze your chart for a clear ongoing bearish trend – the slope of EMA is meant to point to the lower direction, similarly to price levels. Make sure that the candles are aligned below the moving average.
Next, wait for a red arrow to shape up. Once it does, you can jump into a trade a watch price decrease with high probability. Set your stop loss a few pips above the EMA line. When it comes to profit taking, you can use 1:2 ratio or trail SL and take profit at 1:3 ratio.
Bottom line
The Fiji Trend is a solid indicator following short-term trends. It’s especially newbie-friendly as one simply needs to identify the indicator color to be aligned with market direction. This trading tool can be used by itself or with other tools. If you decide to go without any additional filters, take into account occasional fake signals.


