Fiji Trend Indicator MT5
Platform: MT5 Type: Trend Last update: August 22, 2026The Fiji Trend Indicator for MT5 provides trend-following signals with clear entry and exit points, displayed directly on your chart as arrows.
It’s also non-repainting and it helps filter out price noise, which makes its signals more dependable overall.
Example chart:

How to use the Fiji Trend Indicator for MT5?
The Fiji Trend Indicator centers on two sets of arrows. First, a continuous line of blue and yellow arrows tracks the ongoing trend.
Additionally, separate green and red arrows mark the actual buy and sell entries and exits. Underneath, a moving average combined with average true range powers these calculations.
Reading the signals is simple: green (upward) arrows point to buying opportunities, while red (downward) arrows point to selling opportunities.
You can trade these signals in line with the main trend. Alternatively, use them to catch potential reversals. Since reversal setups carry more risk, you should confirm them with additional price action before entering.

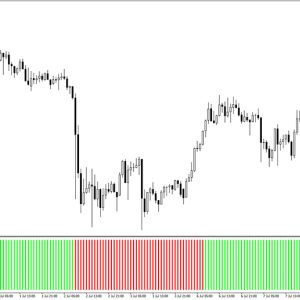
As you can see on the EUR/JPY H1 chart above, the Fiji Trend line runs in a separate window below the price.
It shifts from yellow to blue at each red arrow. Each of these shifts lines up closely with a genuine change in market direction – from the early sideways chop through the strong uptrend toward the right side of the chart.