Forex Entry Point Indicator
MT4 Free DownloadIntroduction to the Forex Entry Point Indicator
The Forex Entry Point indicator for MT4 (MetaTrader 4) was created to provide potentially the best entry and exit forex signals. It’s available to download completely for free.
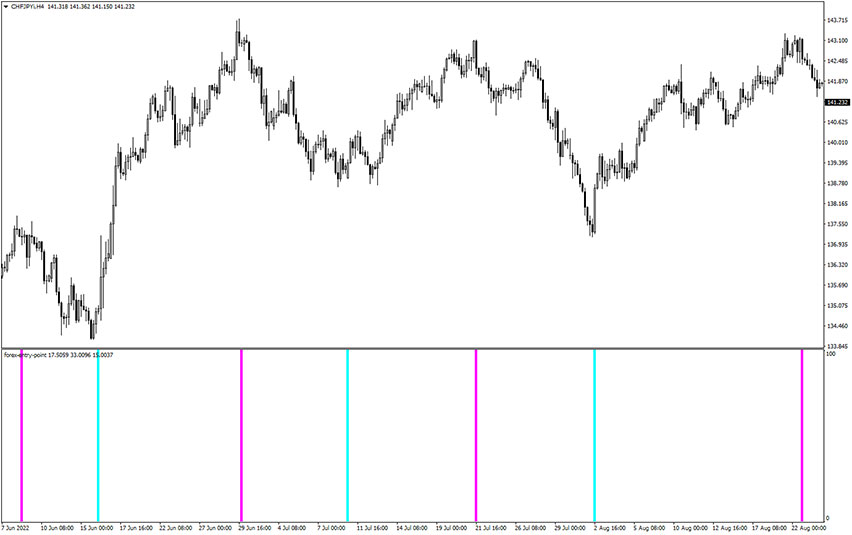
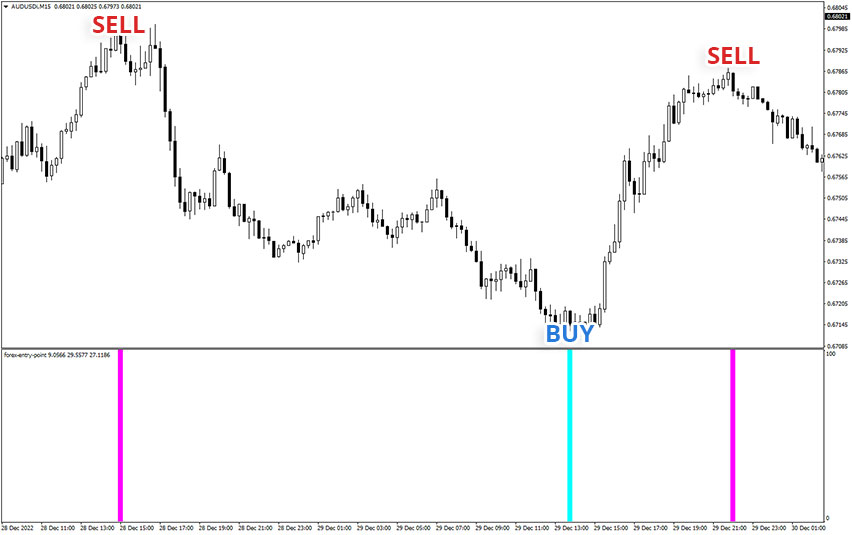
The readings provided by that gauge are simple and straightforward. The aqua lines signal long entries and bullish trends. On the other hand, the magenta lines signal short entries and bearish trends.
It’s suitable for both beginners and advanced forex traders. One can apply it in conjunction with different forex strategies and approaches.
The indicator is displayed in a separate window placed just below the main trading chart.
How does it work? How to apply in trading?
MT4 Indicator Overview
The free download link of the Forex Entry Point indicator is placed at the bottom of this post. Once you’re done, your MT4 trading chart should look similar to the example below.
What Is An Entry Point In Terms Of The Currency Market?
An entry point is a price level at which traders buy or sell currency pairs. The entry price level is determined after thorough technical and fundamental analysis. Good entry points are crucial in becoming a profitable trader. In a perfect world, one would catch entries equal to the tops and bottoms of the market.
Manual Technical Analysis vs Automatic Signals
In the traditional way, technical analysts depend on the manual interpretation of a chart, including price action patterns and readings from complex indicators. When all these elements of the puzzle are put together, they decide on the entry-exit points of a trade.
In fact, it’s a tough job, because many important aspects must be taken into consideration before catching a profitable trade. To name a few: supply and demand levels, potential market reversals, continuation and breakout patterns, etc.
As you can see, it’s not hard to make a simple mistake due to too many factors.
Fortunately, there are tools that provide simple signals and one of them is the Forex Entry Point indicator. It comes in handy if you are not a fan of exhaustive market analysis. Actually, you don’t have to do any analysis at all – just follow the provided entry/exit suggestions based on just two color bars.
Trading Rules Explanation
Signals provided by that gauge are really intuitive and will not cause you difficulties. Simply follow the suggestions below.
Buy Trade with Forex Entry Point
Buy entry signal occurs after the appearance of an aqua color vertical line. The trade should be triggered after the candle closes. Set your Stop Loss below the last swing low of the market. You can take profit once your trade hits the 1:2 risk to reward ratio. Exit trade in the case of the arrival of a magenta color vertical line, as it forecasts trend change.
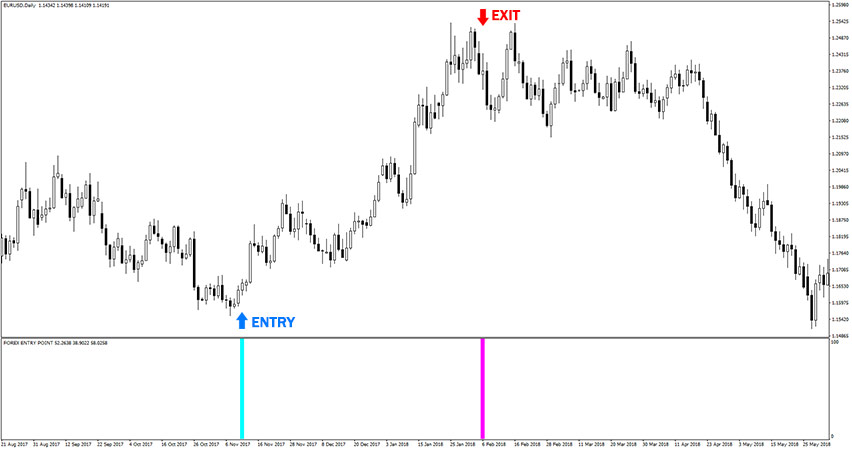
Example of buy trade with Forex Entry Point indicator.
Sell Trade with Forex Entry Point
Sell entry signal occurs after the appearance of a magenta color vertical line. The trade should be triggered after the candle closes. Set your Stop Loss above the last swing high of the market. You can take profit once your trade hits the 1:2 risk to reward ratio. Exit trade in the case of the arrival of an aqua color vertical line, as it forecasts trend change.
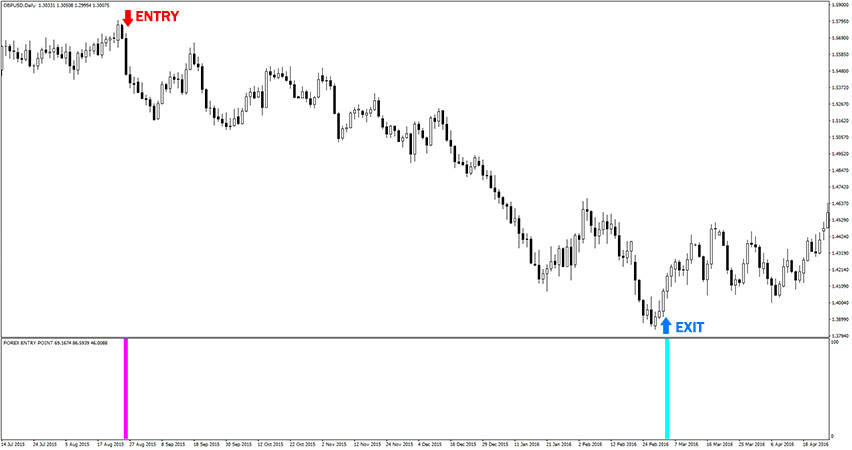
Example of sell trade with Forex Entry Point indicator.
The above instructions were just basic usage. To increase credibility you can use it in a combination of different forex approaches like candlestick patterns, trend channels, breakouts, etc.
Other Factors To Consider
As always, to achieve good results, remember about proper money management.
To be a profitable forex trader you need to master discipline, emotions, and psychology.
It is crucial to know when to trade, but also when not to trade. Avoid trading during unfavorable times and market conditions like low volume/volatility conditions, beyond major sessions, exotic currency pairs, wider spread, etc.
Important note. Sometimes when it plots a line, it may recalculate and replace that line. That issue makes it a NOT no-repainting indicator. Please take that into consideration. Past data look perfect on charts, but in reality, it’s not that reliable.
Using Confluence Strategies For Your Benefit
One of the best ways to increase the success rate is by using it in conjunction with other technical analysis tools. Check some of these strategies below.
Moving Averages
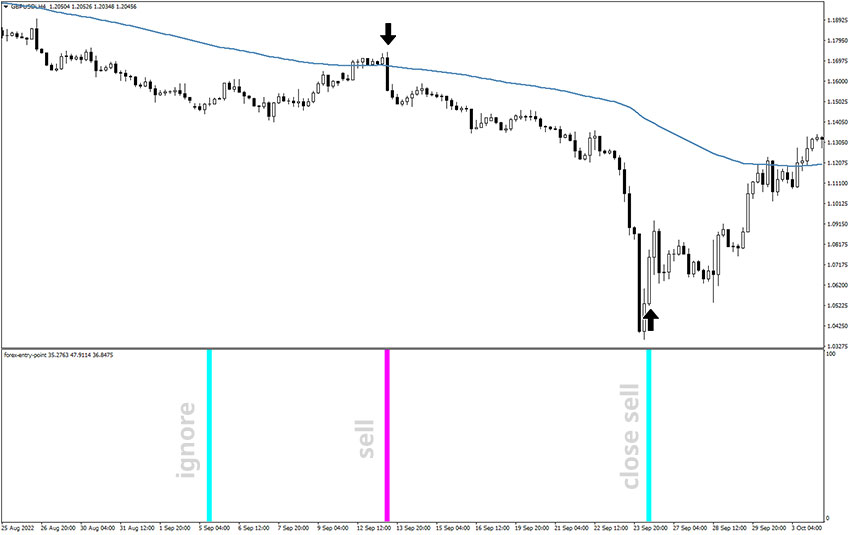
The Moving Average supports trend-following analysis. It’s not hard to study, just take a look at the left and the right side of the screen. If the right part of MA is aligned higher than on the left side, it means the trend is considered bullish. In the opposite scenario, we take the trend as bearish.
In the example below, there is a bearish ongoing trend, therefore you should look for only sell trade opportunities. As you can see, there was the buy signal, but it should be ignored. The sell signal gave a pretty downward impulse, resulting in a lucrative trade.
How to set up the Forex Entry Point indicator in MT4?
Installation Guide
Download the Forex Entry Point.rar archive at the bottom of this post, unpack it, then copy and paste the Forex Entry Point.ex4 or Forex Entry Point.mq4 indicator files into the MQL4 folder of the Metatrader 4 trading platform.
You can gain access to this folder by clicking the top menu options, which goes as follows:
File > Open Data Folder > MQL4 > Indicators (paste here).
Now go to the left side of your MT4 terminal. In the Navigator find the gauge name, right-click it and select Attach to the chart.
Bottom Line
The Forex Entry Point indicator is well worth adding to your trading collection. A good forex indicator will most probably enhance your chance of success.
Nonetheless, remember about having realistic expectations. Just like any other technical analysis tool, is not capable of providing accurate signals 100% of the time. Thus, this forex indicator provides false signals occasionally. Its performance will vary significantly depending on market conditions.
Feel free to develop your own trading system based around it. Don’t forget that we still have more great free forex MT4 indicators to download and try.
Download Free MT4 Forex Entry Point Indicator
To download the Forex Entry Point Indicator for Metatrader 4 (MT4) for free just click the button below:
Forex Entry Point Indicator Free Download
