Hikkake Pattern Indicator MT4
Platform: MT4 Type: Pattern Last update: September 10, 2026The Hikkake Pattern Indicator for MT4 identifies short-term trend reversals based on false breakouts.
This concept favored by reversal traders and particularly effective during sideways market conditions.
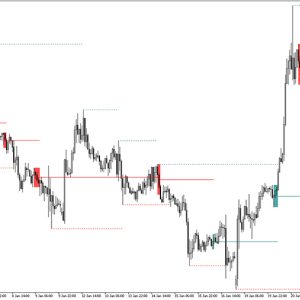
Example chart:

How to use the Hikkake Pattern Indicator for MT4?
The core idea is simple: price fakes a breakout from a rangebound move, only to reverse quickly and continue in the original direction.
This false break is what forms the “hikkake” pattern, a name that translates to “trap” in Japanese.
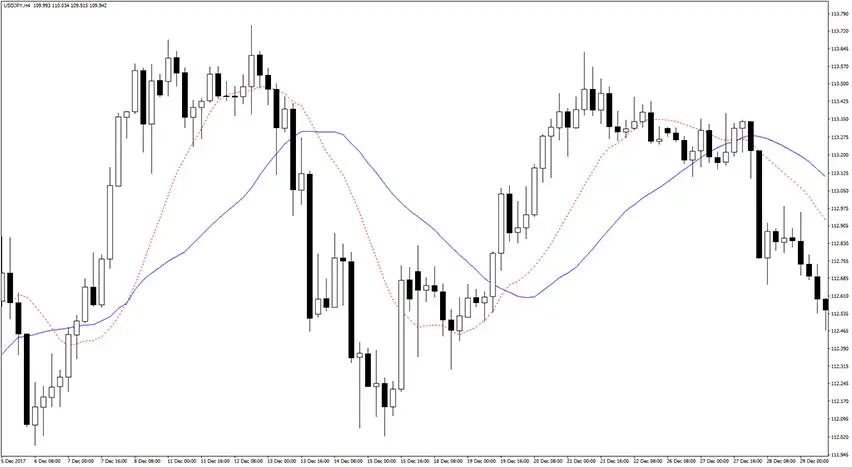
The Hikkake Indicator plots two moving average lines – one solid and one dotted.
During an uptrend, a selling opportunity appears when price touches or crosses below the dotted line. During a downtrend, a buying opportunity appears when price touches or crosses above it.
The typical profit target sits a few candles beyond the solid line once price crosses it.
The gap between the two lines matters too. A wider gap generally signals a more reliable setup, while a tight, overlapping alignment is best avoided.
Trading rules
The Hikkake Pattern uses the relationship between the dotted and solid lines to identify potential trade setups.
Long trade
For a long trade, wait for the dotted line to sit below the solid line with a healthy gap between them.
Then enter once price crosses back above the dotted line. Set your stop loss a few pips below the recent market low.

As you can see on the GBP/USD H4 chart above, the buy trade was triggered when price crossed back above the dotted line.
This happened after a false breakdown. The take profit was reached once price pushed through the solid blue line and continued climbing.
Short trade
Shorts work the mirror image of this setup. The solid line now sits below the dotted one.
The trigger comes when price crosses back down through the dotted line after a failed push higher.
Place your stop loss a few pips above the recent market high. Expect price to keep falling past the solid line before the move runs its course.

The second GBP/USD H4 chart shows exactly this: the sell trade triggered as price crossed below the dotted line after a false breakout to the upside.
The take profit reached as price broke through the solid line and continued falling.
Conclusion
The Hikkake Pattern Indicator for MT4 work is exactly what makes it easy to miss.
Most traders get caught on the wrong side of the initial fake breakout, which is what fuels the sharp reversal once the trap closes.
Reading the pattern means training yourself to distrust the first move and wait for the snap-back instead.