Linear Regression Channel Indicator
Platform: MT5 Type: Channel Last update: January 21, 2025The Linear Regression Channel Indicator for MT5 is responsible for placing five leaning lines that together form an channel. They are calculated based on the maximum deviation. The most external ones define boundries and limits of price, you can consider them as support and resistance levels.
What’s more, the slope suggests the trend direction. In terms of size and period, it’s based on a specified, but adjustible number of bars back (default: 150) from the most recent candle.
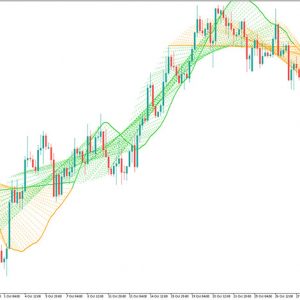
Example chart:

How to get most out of the linear regression channel?
Forex traders should pay special attention when the price approaches the lower or higher red dotted band. These are areas where there is high probability of potential upcoming reversal.
As a rule of thumb, when candlesticks are above the blue line, only short trades should be considered. Conversely, when they are below it, only long opportunities should be taken into account. The price often reverts to the blue regression line after touches like that, so actually this is a smart take profit target.
A breakout outside the channel may also happen from time to time. Such scenario may indicate start of a new trend.
Submit your review | |