MACD 4C Indicator
Platform: MT4 Type: Momentum Last update: October 13, 2024The MACD 4C Indicator for MetaTrader 4 platform is a tool created for forex traders that favor trend-momentum strategies. It informs users about recognized trends by showing four colors within colorful histogram bars. Let’s take a look how it differentiates from traditional MACD and how to apply in trading.
The MACD 4C is based on the standard and well-known MACD, but it has some additional enhancements and variations. The full name of MACD is Moving Average Convergence/Divergence and it’s worth to note that it’s most commonly used technical analysis indicator. It wouldn’t be so popular if it provided poor or unreliable results. Most successful forex or stock traders and even funds managers apply technical analysis to predict future price movements with high probability.
Comparing MACD 4C to traditional MACD
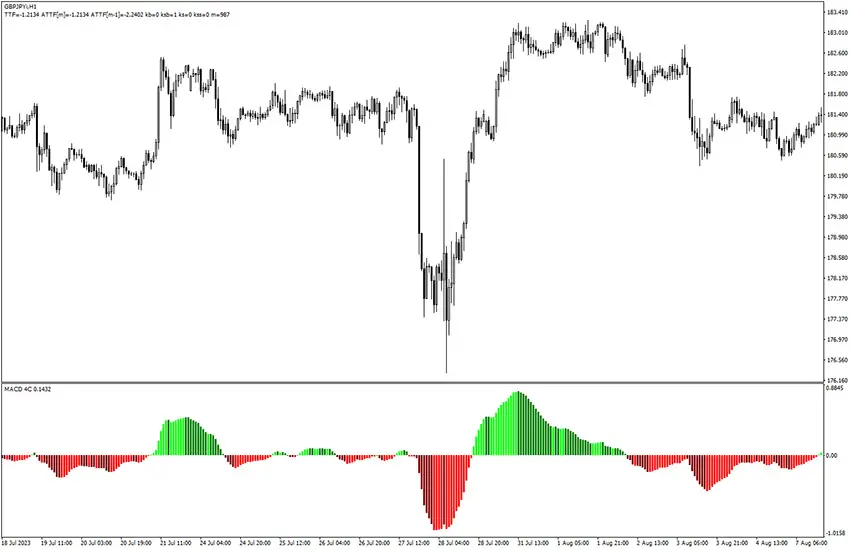
The MACD 4C displays signals in the form of histogram with specific colors of its bars. Actually, there are four colors – two shades of red color for bear market and two shades of green for bull market. Despite colors, integral part of trend direction and strenght measure is aligment of histogram bars in relation to zero level.
The regular MACD displays two signal lines and their crossovers, but users of MACD 4C are rather focused on the histogram bars as they are starting point for trading decisions.
Let’s take a look at the example chart below.

These are general suggestions on how to interpet the signals:
- When the bars are below zero level it means that trend-momentum is considered bearish. The dark red bars reflect strong downward force, while light red signals exhausting bearish movement.
- When the bars are above zero it means that trend-momentum is considered bullish. The light green bars signal strong upward force in the martket, while darker green bars reflect buyers are fading away.
The MACD 4C is a great tool to use in accompaniment with other technical indicators whether they are used for filtering or confirming the signals – together they may form a reliable trading strategy. Some ideas are presented below.
MACD 4C and Moving Average
One of the approaches is to combine MACD 4C with Moving Average. We have decide to use 100-period Exponential Moving Average, but feel free to take one of your choice.
Let’s analyze an example of bullish setup. The price should be floating above the EMA and bars of MACD 4C should be above the 0 level.
The plan is to wait for an pullback and enter a trade when momentum resumes and overall trend is still clearly upward. In order to do so, observe histogram bars till they become dark green and relatively small. The trend would be resumed when light green histogram bar appears along with price action confirmation.

MACD 4C and Supply Demand Zones
Another interesting combo would be a supply and demand zones indicator to define important market levels, a price action analysis for trade entries (rejection of a zone) and 4C MACD for riding the trend-momentum till the very end of it.
Observe price action patterns to reject a zone and once it happens, you can take advantege of strong momentum by keeping the trade open along with light green histogram bars of MACD 4C.
Take a look at this example blow.

Conclusion
The MACD 4C indicator for MT4 will be an added value for all traders familiar with technical analysis, as it will support them with visual representation of MACD histogram bars. This is rather choice of experienced traders who know how to use different tools in confulence.
Submit your review | |