MACD Squeeze Indicator
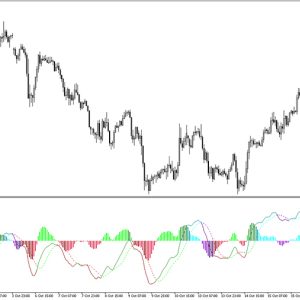
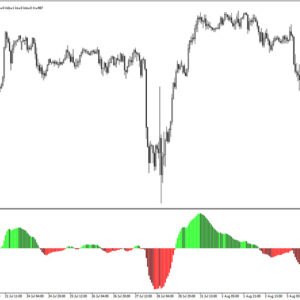
Platform: MT5 Type: Momentum Last update: December 8, 2024The MACD Squeeze Indicator for MT5 represents a special squeeze technique based on three core elements. While signals provided by this gauge are displayed as a simple histogram, in essence, there is a more complex formula behind the scenes. Let’s take a look in more details.
MACD squeeze strategy in MT5
So, the main elements that consists for the indicator are:
- Moving Average Convergence Divergence
- Bollinger Bands
- Keltner Channel
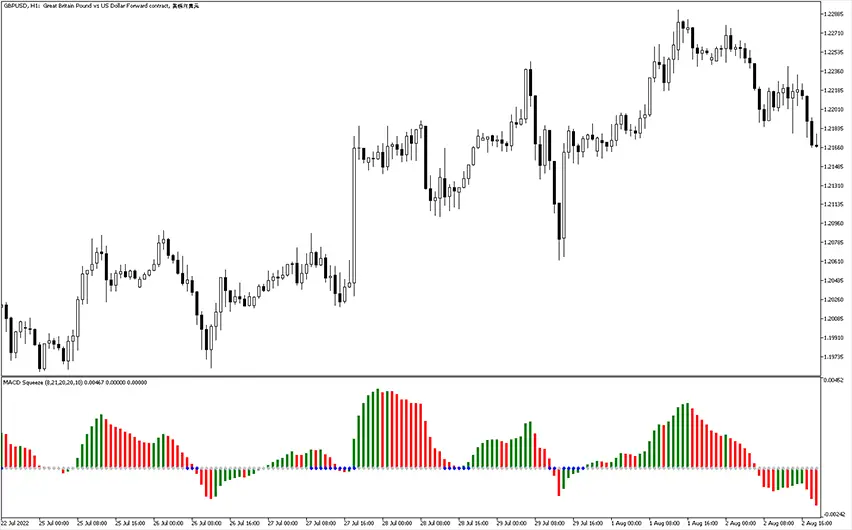
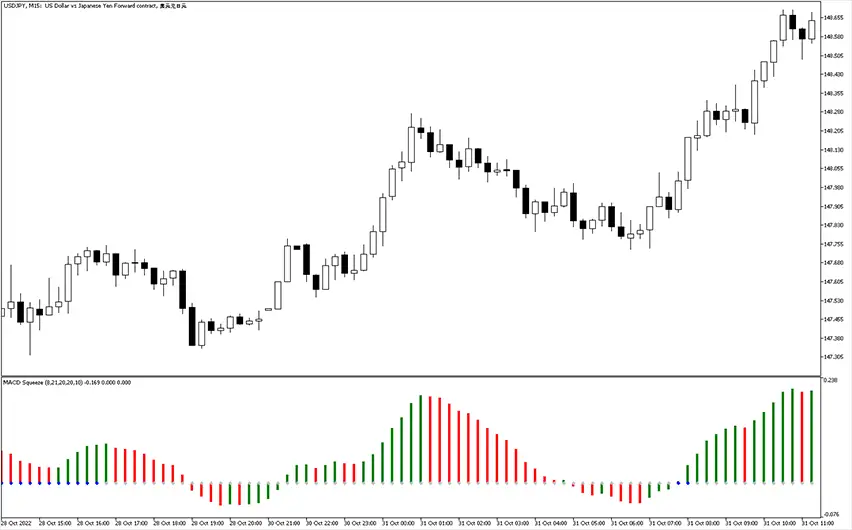
The concept for trading with this strategy is based on setup where the Bollinger Bands are located within Keltner Channel bands. When this scenario is in place, these trading zones are considered valid and they are marked with corresponding gray dots to notify users.
Here are general suggestions for utilizing this approach.
Buy Signal
Open a long position when both the green and red histograms break out and remain above the zero center line. Close order when a bullish trend is in progress, and the blue signal dot appears on the zero center line.
Sell Signal
Open a short position when both the green and red histograms break out and remain below the zero center line. Close order when a bearish trend is in progress, and the blue signal dot appears on the zero center line.
Bottom line
As you can see, this is a interesting combination of three popular forex indicators. The two channel-type ones define trading boundaries and classic MACD histogram bars serve as entry points. It can be enhenced further when applied trend technical analysis tools.
Submit your review | |