MACD Colored Histogram Indicator
Platform: MT4 Type: Momentum Last update: December 7, 2024The MACD Colored Histogram Indicator for MetaTrader 4 is a high-demand trading gauge as the Moving Average Convergence and Divergence is one of the most popular forex indicators out there. This is a variation of the classic MACD and will be further described in the next parts of this article.
Closer look on the MACD Colored Histogram Indicator
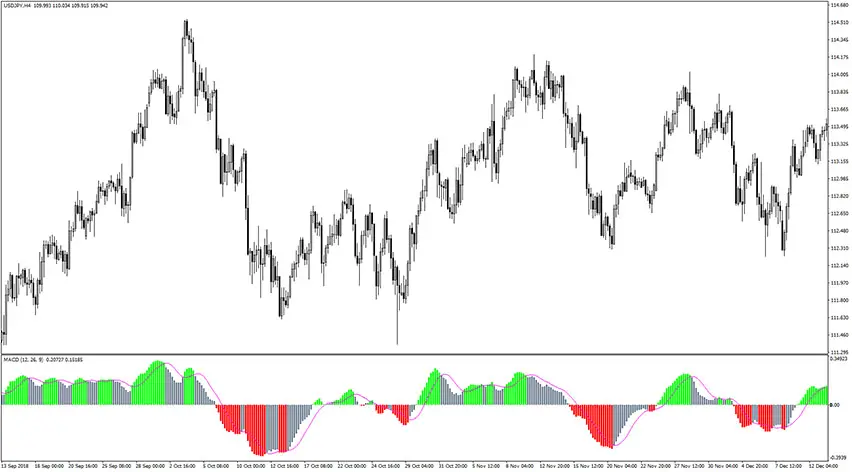
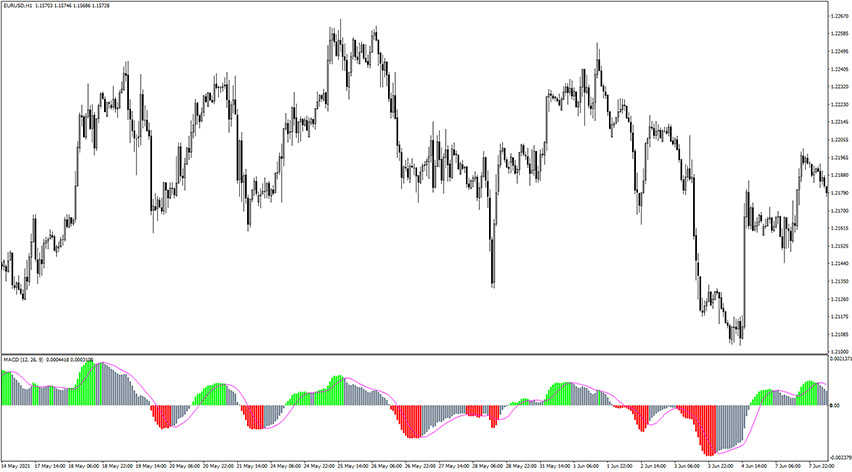
The main difference between the original MACD and MACD Colored Histogram is that it clearly shows traders where price might reverse or resume momentum. When you look at the chart, you will notice that histogram bars change colors to indicate trend and momentum direction. There are green, red and grey bars. Green bars indicate bullish momentum, red bars indicate bearish momentum, and grey bars indicate potential reversal coming underway.
Buy Trade Example
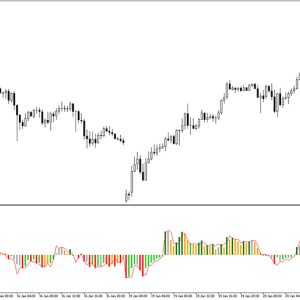
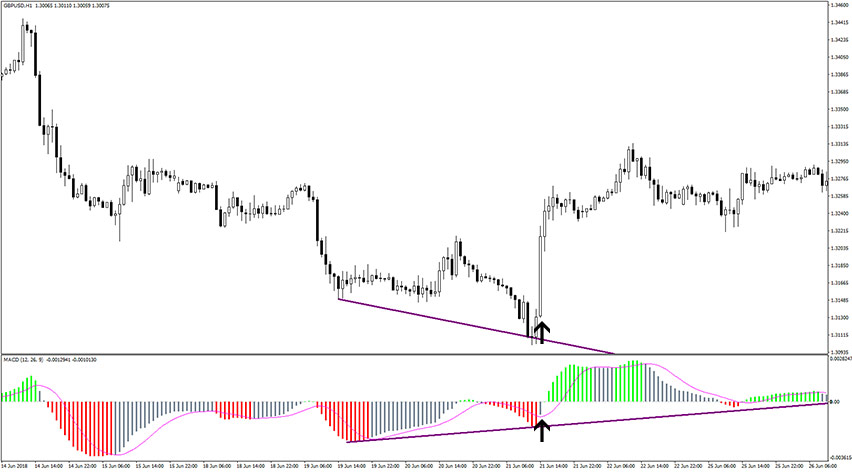
In the example below, trade is based on the bullish divergence that is taking place. Histogram bars made a lower low and higher low, while price made a higher low and lower low. The trade was triggered at the first grey histogram bar after divergence.
Sell Trade Example
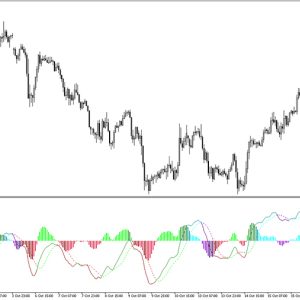
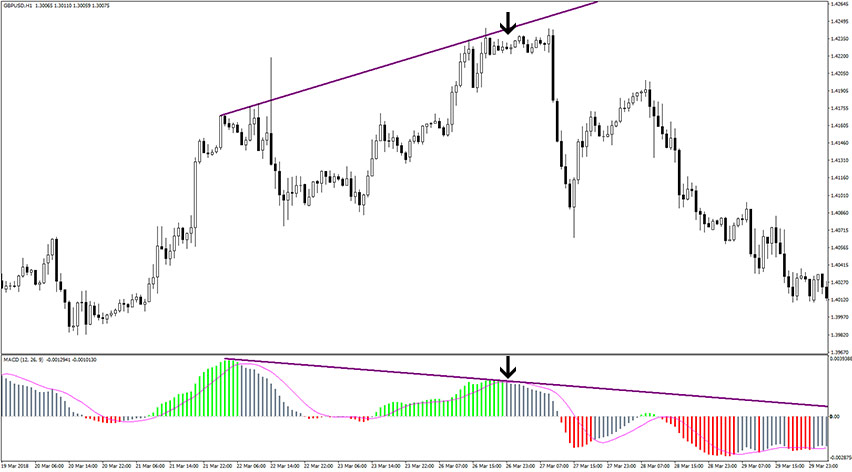
In the example below, trade is based on the bullish divergence that is taking place. Histogram bars made a higher high and lower high, while price made a lower high and higher high. The trade was triggered at the first grey histogram bar after divergence.
Submit your review | |