Introduction to the Parabolic Regression Stop & Reverse Indicator
The Parabolic Regression Stop & Reverse Indicator is a pretty complex forex indicator as it calculates the dynamic regression channel and trendline channel. Therefore, it may be considered as a standalone mini-trading system. It provides all the necessary data for complete trading, including entry points and exits points. A trader should have some experience to utilize that tool properly, however beginners forex traders can it a try too.
The Parabolic Regression Stop & Reverse Indicator fits all kinds of timeframes and currency pairs. It is displayed directly on the main trading chart. The default settings can be modified directly from the input tab. Feel free to experiment with the settings and parameters to fit your personal preferences.
How does it work? How to apply in trading?
Trading Rules Explanation
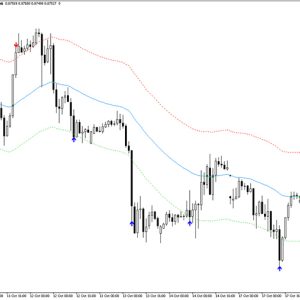
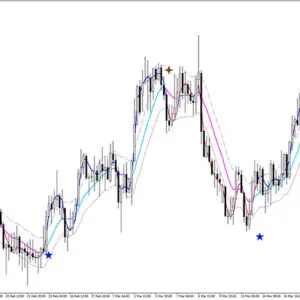
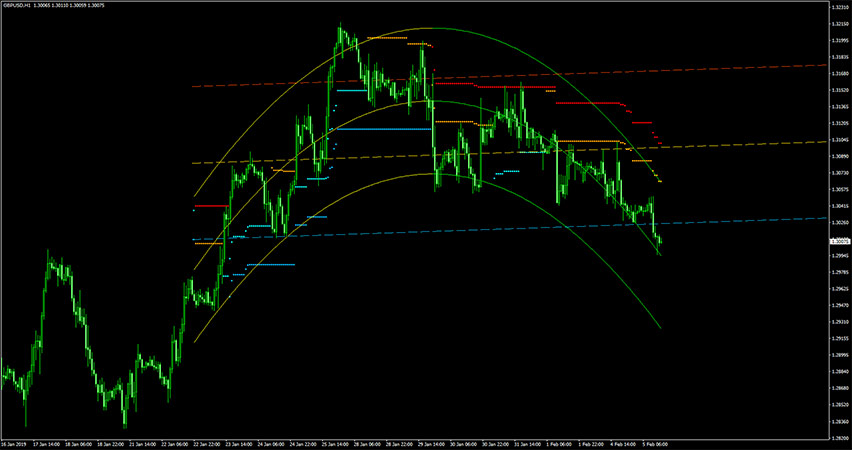
The Parabolic Regression Stop & Reverse Indicator consists of several elements. The core are two channels: curvy continuous Regression Channel and discontinuous Trendline Channel. Regression Channel is colored yellow when the slope is upwards and therefore the trend is considered bullish. Similarly, it is colored green when the slope is downwards and the trend is considered bearish. There are also Stop&Reverse dots that work as dynamic support and resistance.
Buy Signal
Follow these steps for a long trade:
- The slope of both Regression Channel and Trendline Channel is upwards
- Price touches lower band of both channels
- Price rejects these levels and forms bullish pattern
- Buy trade is triggered after the above conditions are met
- Set stop loss a few pips below the last low swing of the market
- Take profit or exit trade whenever the price hits a opposite band of one of the channels
Sell Signal
Follow these steps for a short trade:
- The slope of both Regression Channel and Trendline Channel is downwards
- Price touches upper band of both channels
- Price rejects these levels and forms bearish pattern
- Sell trade is triggered after the above conditions are met
- Set stop loss a few pips above the last high swing of the market
- Take profit or exit trade whenever the price hits a opposite band of one of the channels
As always, to achieve good results, remember about proper money management. To be a profitable trader you need to master discipline, emotions, and psychology. It is crucial to know when to trade, but also when not to trade. Avoid trading during unfavorable times and market conditions like low volume/volatility conditions, beyond major sessions, exotic currency pairs, wider spread, etc.
How to set up the Parabolic Regression Stop & Reverse indicator in MT4?
Installation Guide
Download the Parabolic Regression Stop & Reverse.rar archive at the bottom of this post, unpack it, then copy and paste the Parabolic Regression Stop & Reverse.ex4 or Parabolic Regression Stop & Reverse.mq4 indicator files into the MQL4 folder of the Metatrader 4 trading platform.
You can gain access to this folder by clicking the top menu options, which goes as follows:
File > Open Data Folder > MQL4 > Indicators (paste here).
Now go to the left side of your MT4 terminal. In the Navigator find the gauge name, right-click it and select Attach to the chart.
Bottom Line
The Parabolic Regression Stop & Reverse indicator is well worth adding to your trading collection. A good forex indicator will most probably enhance your chance of success. Nonetheless, remember about having realistic expectations. Just like any other technical analysis tool, is not capable of providing accurate signals 100% of the time. Thus, this forex indicator provides false signals occasionally. Its performance will vary significantly depending on market conditions. Feel free to develop your own trading system based around it.
Download Free Forex MT4 Parabolic Regression Stop & Reverse Indicator
To download the Parabolic Regression Stop & Reverse Indicator for Metatrader 4 (MT4) for free just click the button below:
Parabolic Regression Stop & Reverse Indicator Free Download