Parabolic SAR Indicator
Platform: MT4 Type: Trend Last update: September 29, 2024The Parabolic SAR Indicator for MT4 is a forex technical analysis tool used to trade with the trend direction, but also to identify points of potential stops and reverses. In fact, the SAR abbreviation in Parabolic SAR stands for “Stop and Reverse”.
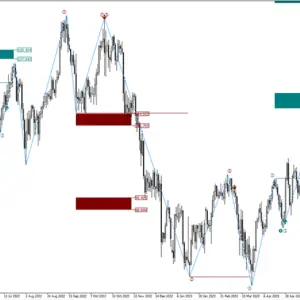
The indicator is made of dots that flow above or under the price. When these dots of Parabolic SAR hover above the price, they indicate a bearish trend. Conversely, when dots of Parabolic SAR immerse below the price, they indicate a bullish trend. This forex gauge became very popular and can be used for scalping, day trading, and short-term swing trading.
A bit of history
J. Welles Wilder developed the Parabolic SAR (SAR) and introduced it to the world in his book New Concepts in Technical Trading Systems. The book was published in 1978 and also featured several other indicators, which are now considered classic indicators, such as: Relative Strength Index, Average True Range and the Directional Movement Index.
Much like the indicators mentioned, the Parabolic SAR indicator is still widely used and has great importance in the world of technical analysis in forex and stock markets.
How to trade with the parabolic sar indicator?
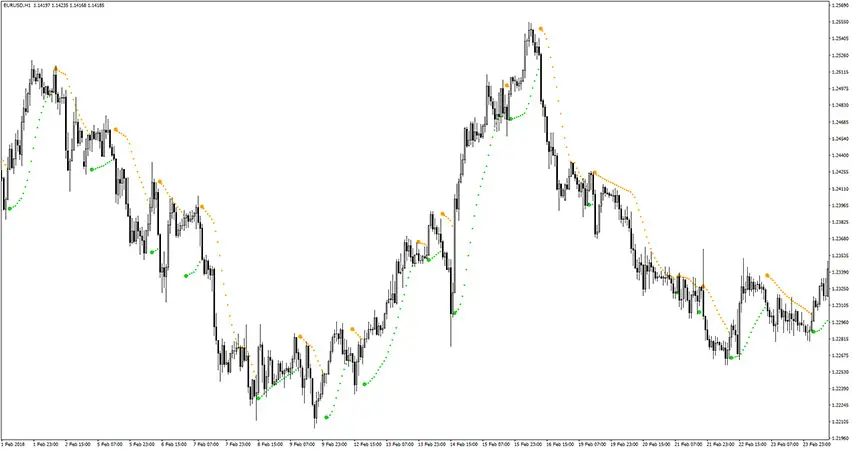
As we mentioned in the beginning, the Parabolic SAR indicator signals are presented in the form of dots that goes above or below the price.
If the price crosses Parabolic SAR lines, the indicator dots turn upside down, and its further values are located on the other side of the price. When such a turn takes place, the maximum or the minimum price for the previous period would serve as the starting point.
When the indicator makes a turn, it gives a signal of the trend end (correction stage or sideway). The Parabolic SAR is also an incredible indicator for providing exit points.
Long positions should be closed when the price sinks below the SAR line, and similarly, short positions should be closed when the price rises above the SAR line. It is often the case that the indicator dots serve as trailing stop points.
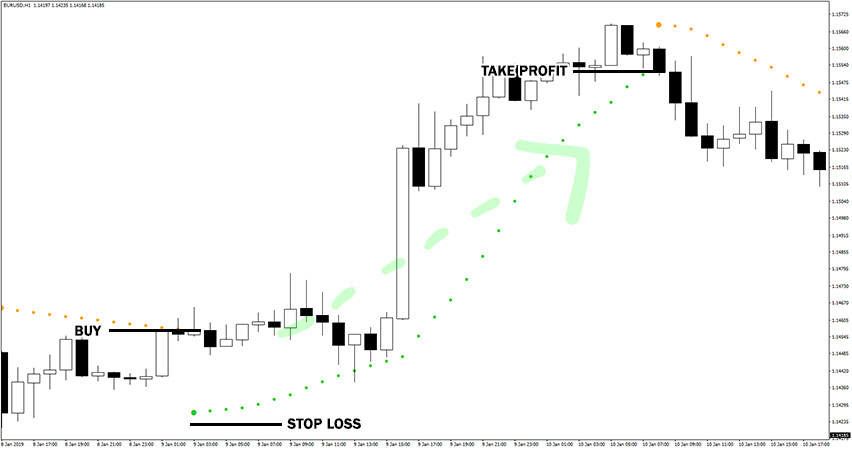
Buy Signal
Follow these steps for a long trade:
- The Parabolic SAR turns below the price and displays green dot
- Buy trade is now triggered
- Set stop loss a few pips below the bigger green dot at triggering candle
- Take profit or exit trade whenever the Parabolic SAR provides opposite signal
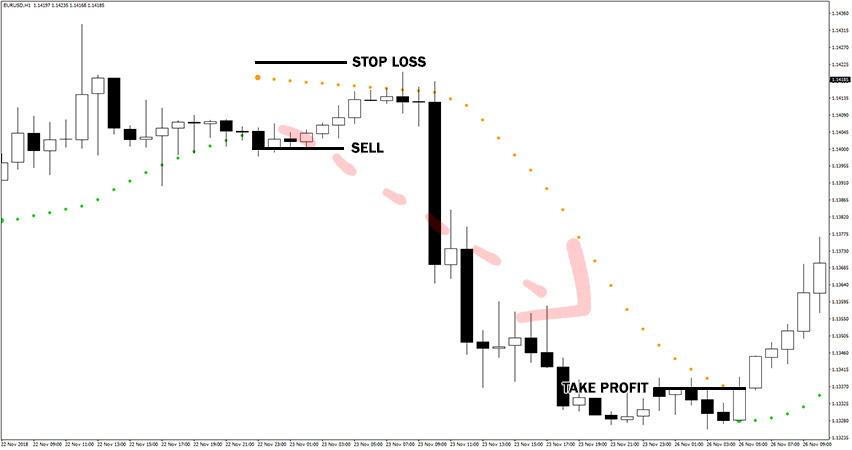
Sell Signal
Follow these steps for a short trade:
- The Parabolic SAR turns above the price and displays orange dot
- Sell trade is now triggered
- Set stop loss a few pips above the bigger orange dot at triggering candle
- Take profit or exit trade whenever the Parabolic SAR provides opposite signal
Formula
The formula to calculate the Parabolic SAR values is the following:
Parabolic SAR n = current SAR value parabolic SAR n + 1 = next day’s SAR value EP = extreme point a = acceleration (usually set to 0.02) Parabolic SAR n + 1 = parabolic SAR n + a (EP – parabolic SAR n)
The calculation for the Parabolic SAR Indicator is usually unique with every price trend. Its value is determined in advance. The value for the next day’s SAR is dependent on the current SAR value. Its values converges above and below the last calculated values based on the trend direction.