Precision Trend Histogram Indicator MT4
Platform: MT4 Type: Trend Last update: September 20, 2026The Precision Trend Histogram Indicator for MT4 strips trend analysis down to two colors.
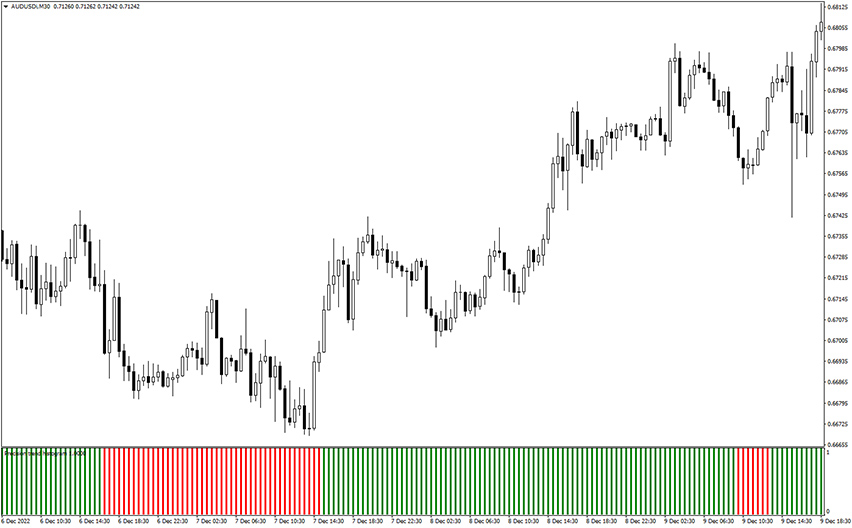
Instead of reading a moving average’s slope or comparing multiple lines, you just glance at whether the bars below the chart are red or green.
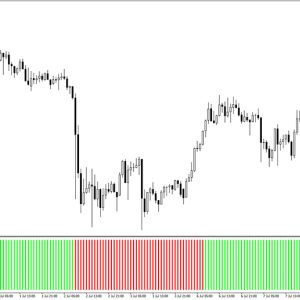
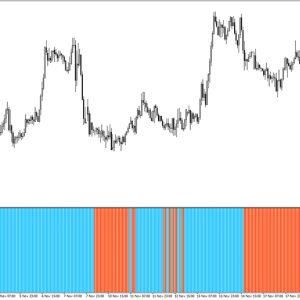
Example chart:
How to use the Precision Trend Histogram Indicator for MT4?
The Precision Trend Histogram Indicator is best used to identify the general direction of the market.
Therefore, it should be treated primarily as a filter rather than a standalone signal provider.
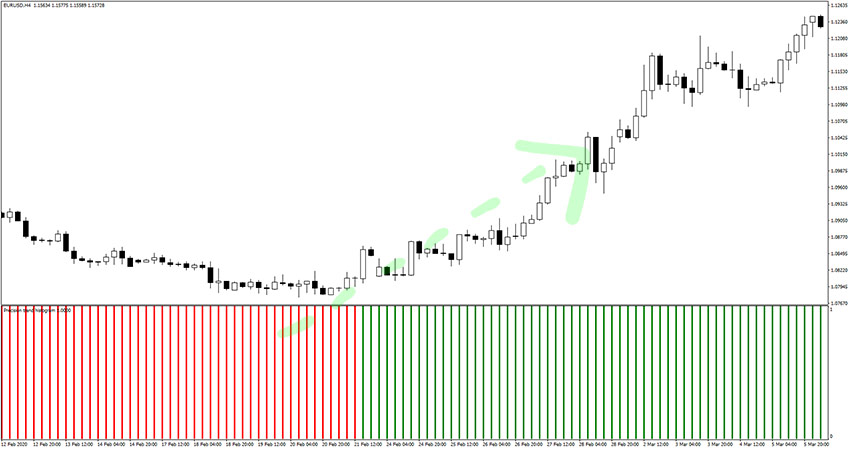
Take a look at this EUR/USD H4 chart.
Reading color changes and trend reversals
As you can see, the bars change from red to green as the price reaches a bottom and starts moving higher. This shows how the histogram can clearly highlight a change in trend.
A color change can be an early sign of weakening momentum. However, it does not always mean a reversal is coming. Price may continue moving in the same direction for a while.
For this reason, wait for confirmation from price action. Do not treat every color change as an automatic exit signal.
The Precision Trend Histogram works on any timeframe. However, it tends to filter out more noise on higher timeframes. Color changes are then less likely to be caused by minor, short-term price fluctuations.
Bottom Line
The Precision Trend Histogram Indicator for MT4 does one job well: keeping you oriented on the dominant trend without cluttering the chart.
It works fine on its own as a directional filter, but pairing it with a dedicated entry tool gives you both the “what direction” and the “when” needed for a complete trading setup.