Relative Volatility Index Indicator MT5
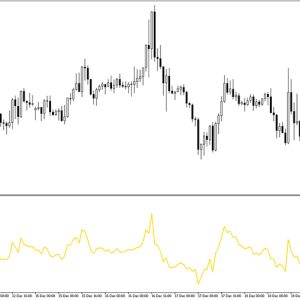
Platform: MT5 Type: Volatility Last update: October 17, 2025The Relative Volatility Index Indicator for MT5 consists of two color-filled floating areas which suggest whether the current volatility is bullish or bearish. The indicator is originally coded to support multi-time frame analysis and provides alerts.
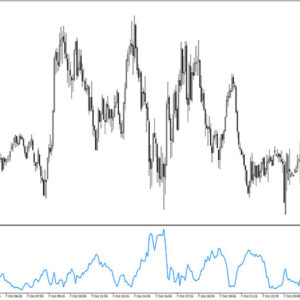
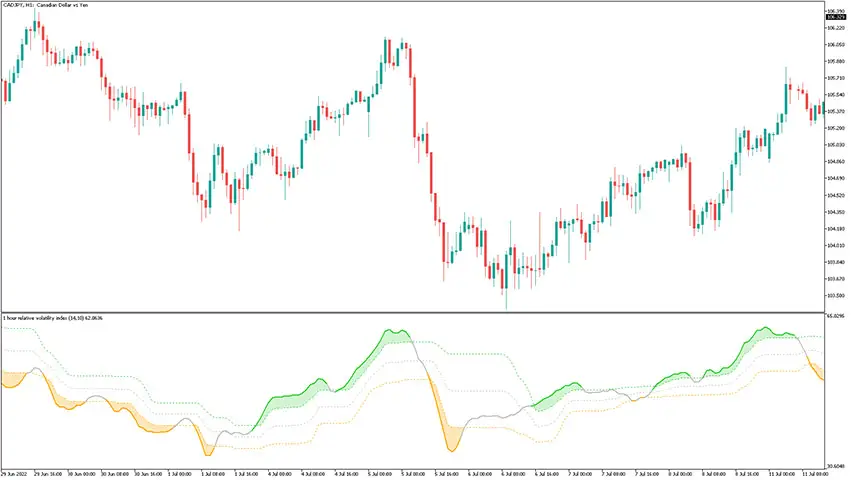
Example chart:
How to use the relative volatility index indicator for mt5?
When the floating area is greenish – it means the volatility suggests bullish movement. Similarly, the orangish floating area indicates bearish ongoing volatility. There are also periods of neutral activity. This CAD/JPY M5 chart shows such areas.

Settings
The indicator is highly customizable, however changing some of the important inputs may result in a completely different nature of that tool. The author suggests keeping the floating levels to > 1 and the smoothing to > 1. These are available inputs: