Starc Bands Indicator MT4
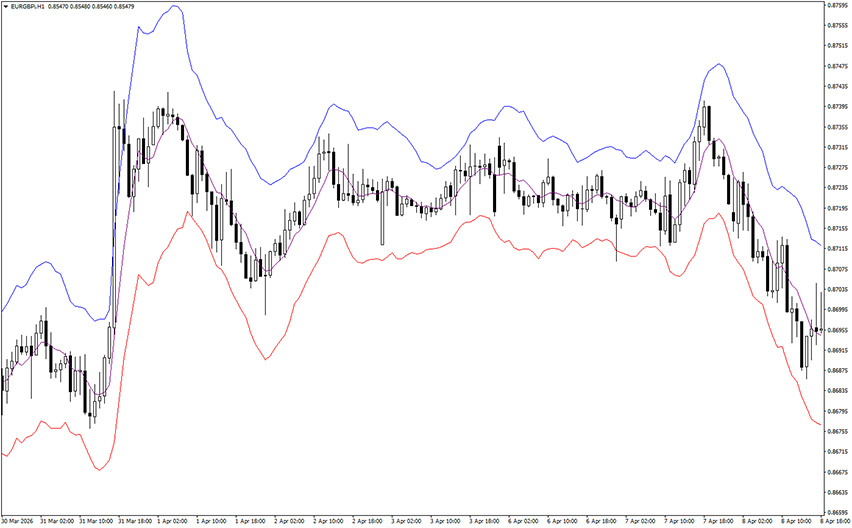
Platform: MT4 Type: Channel Last update: August 16, 2026The Starc Bands Indicator for MT4 displays a dynamic volatility channel around short-term moving average using average true range. It helps to spot overbought and oversold price levels.
The STARC abbrevation stands for Stoller Average Range Channels.
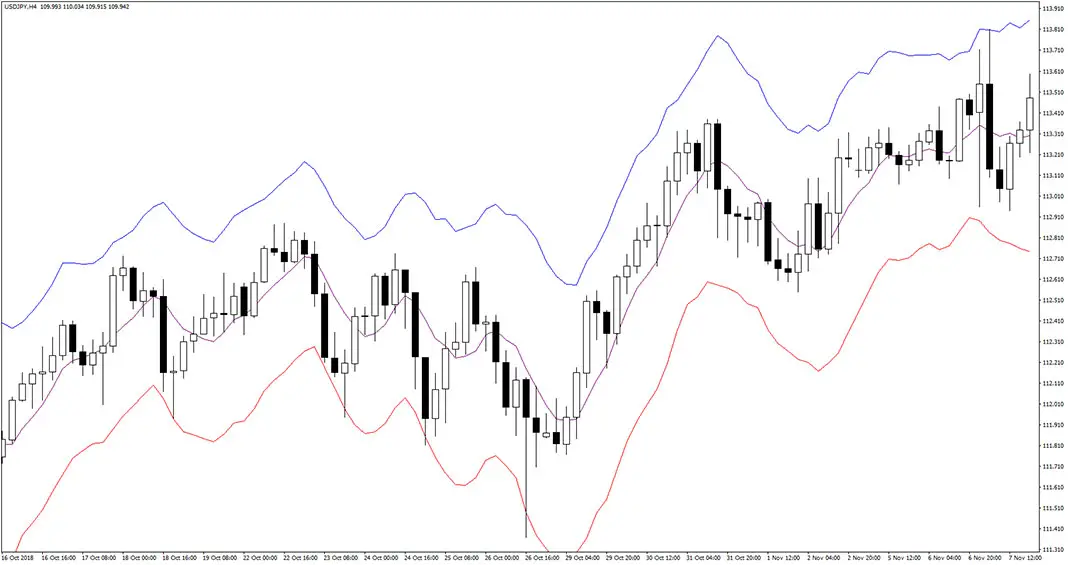
Example chart:
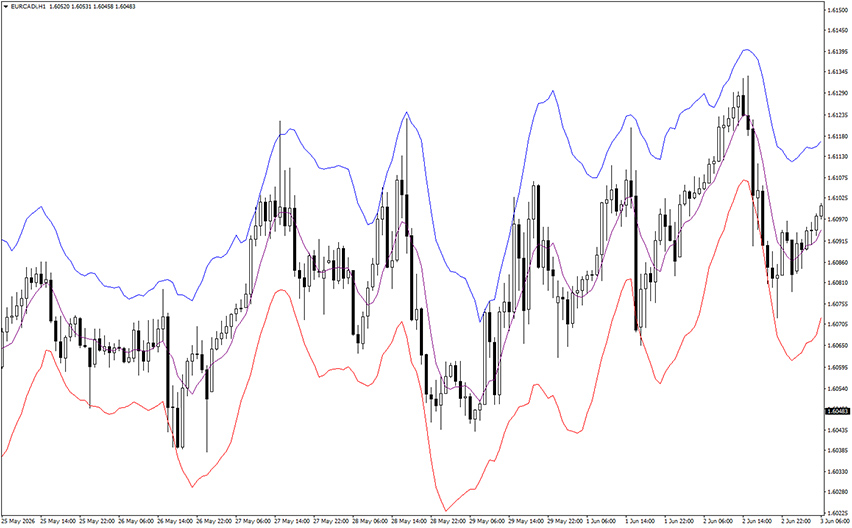
How to use the Starc Bands Indicator for MT4?
The STARC Bands Indicator is built around a simple idea: price tends to stay within a defined volatility range around its average.
The indicator plots a centerline using a moving average, then adds an upper and lower band based on standard deviation, typically two deviations out.
These bands expand and contract automatically as volatility changes. Consider them as dynamic support and resistance.
Price near the upper band signals overbought conditions, often followed by a pullback toward the central moving average. Price near the lower band signals oversold conditions, often followed by a move back up toward the centerline.
A move outside either band tends to point to a coming breakout or reversal.