Super Trend Hull Indicator MT5
Platform: MT5 Type: Trend Last update: October 19, 2025The Super Trend Hull Indicator for MT5 is a combination of two popular forex indicators. Just like the standard super trend, it still displays signals as a single-sided colored band on the chart.
The enhancement lies in its use of the hull formula, which refines the signal calculation for smoother and more responsive trend detection.
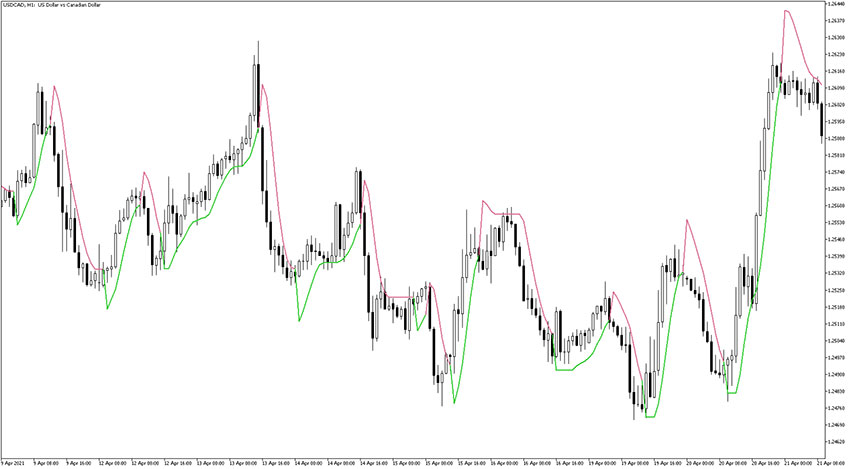
Example chart:

How to use the super trend hull indicator for mt5?
The indicator plots a dynamic line that also functions as a support or resistance band, since price often tends to bounce off it.
When the line appears below the candlesticks, it indicates a bullish setup and is colored green. Conversely, when it appears above the candlesticks, it signals a bearish condition and turns pink.
The super trend hull provides both entry points and exit suggestions. A closed candle following a color change represents a potential entry point in the direction of the new trend. When it switch color again, this means a possible exit or trend reversal. Regarding stop loss, we suggest to put in a few pips away from the last swing high or low level.
Example trade analysis
Take a look at this USD/CAD H1 chart.

As you can see, the price approached the psychological round level of 1.2900 (highlighted by thick red horizontal line), where traders should expect a meaningful market reaction.
In this case, a potential short opportunity was expected and one that was later confirmed by the super trend hull. When the indicator turned pink, it generated a short signal, leading to an excellent entry with a strong risk-to-reward outcome.
Other tips
Our general recommendation when using this or any other indicator is to always interpret signals within the broader market context and considering the current trend phase, market cycle, price structure before making decisions.
Settings
There are four customizable inputs:
- Hull period – defines the smoothing length used in the HMA calculation; higher values produce smoother but slower signals (default value: 24)
- Price – specifies which price value (default value: “median”)
- ATR period – determines the number of periods used to calculate the ATR, which affects the indicator’s volatility sensitivity (default value: 12)
- ATR multiplier – adjusts how much the ATR influences the distance of the indicator line from price (default value: 0.66)


