Swami CCI Indicator MT4
Platform: MT4 Type: Oscillator Last update: July 10, 2025The Swami CCI Indicator for MT4 is responsible for displaying a white line over a background of gradient bars that fade between green and pink.
As the name suggests, it’s partially based on the readings from the famous Commodity Channel Index (CCI).
Example chart:

How to use the swami cci indicator for mt4?
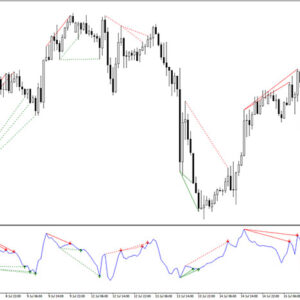
When the swami cci’s white signal line rises above the 80 level and the background bars are green, it indicates the market is overbought, and a sell opportunity may be forming. Conversely, when the white line drops below the 20 level and the background bars are pink, it suggests an oversold market, signaling a potential buy trade.
Take a look at the GBP/USD H4 chart.
You can see a bullish setup marked with a blue arrow. The signal line entered the oversold area, the swami bars turned green, and both the line and price began to rise. This trade resulted in a significant profit.