Visual MACD Indicator
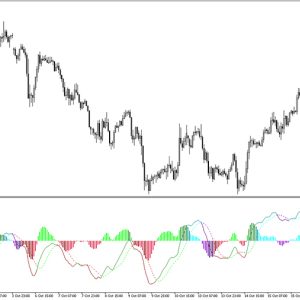
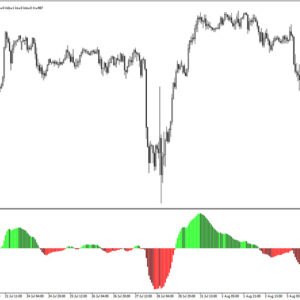
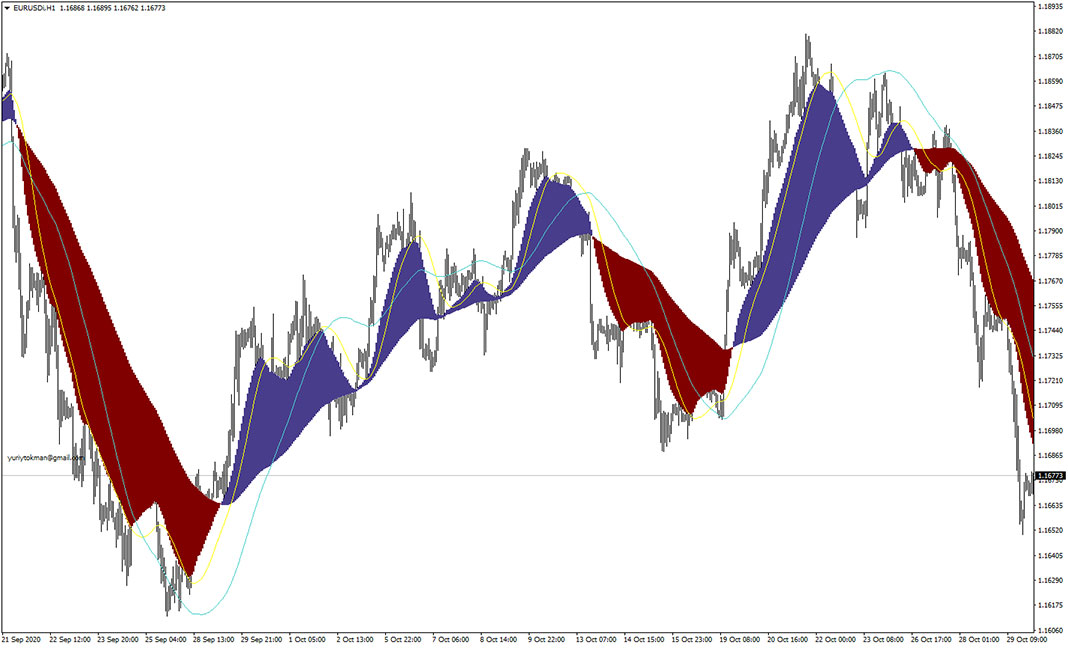
Platform: MT4 Type: Channel Last update: September 30, 2024The Visual MACD Indicator is a forex technical analysis tool based on Moving Average Convergence Divergence, but it is plotted directly on the main trading chart.
It is a short-term trend following indicator.
You should look for buy trades when the MACD wave is blue. Similarly, you should look for sell trades when the MACD wave is red.
We suggest to use it as a filter for opening and exiting transactions. Go ahead and add it to your best trading system.