Vortex Ultimate Indicator MT4
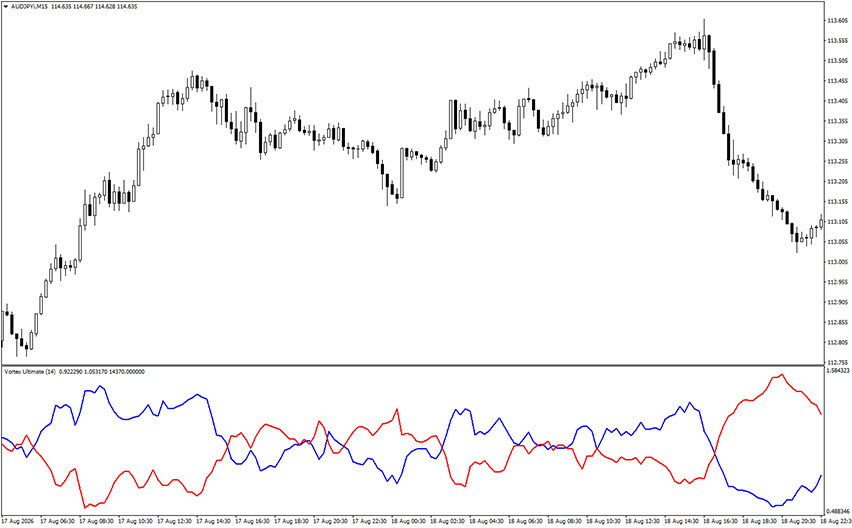
Platform: MT4 Type: Trend Last update: September 27, 2026The Vortex Ultimate Indicator for MT4 is a two-line oscillator. It measures trend strength by comparing how far price moves up and down between consecutive bars.
Unlike many oscillators, it does not rely on a single momentum calculation.
Instead, it uses the relationship between upward and downward price movement to help identify the strength and direction of a trend.
Example chart:
How to use the Vortex Ultimate Indicator for MT4?
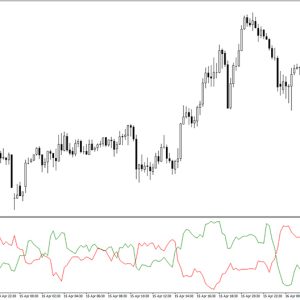
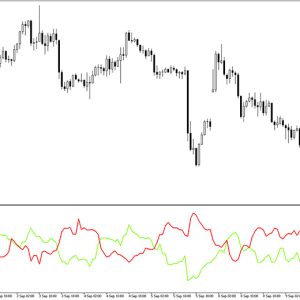
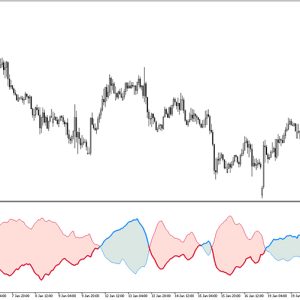
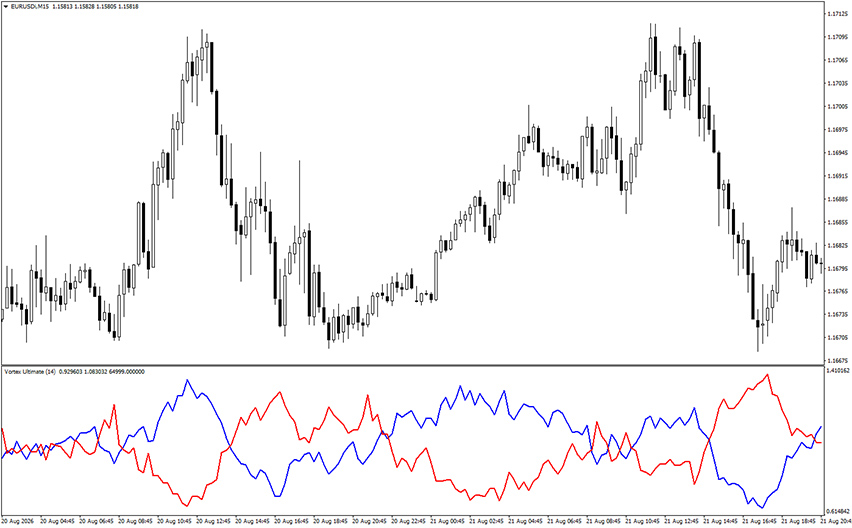
The Vortex Ultimate Indicator plots two lines – typically red and blue. They track negative and positive directional movement.
Whichever line sits above the other tells you which side currently has control: blue above red points to bullish momentum, red above blue points to bearish momentum.
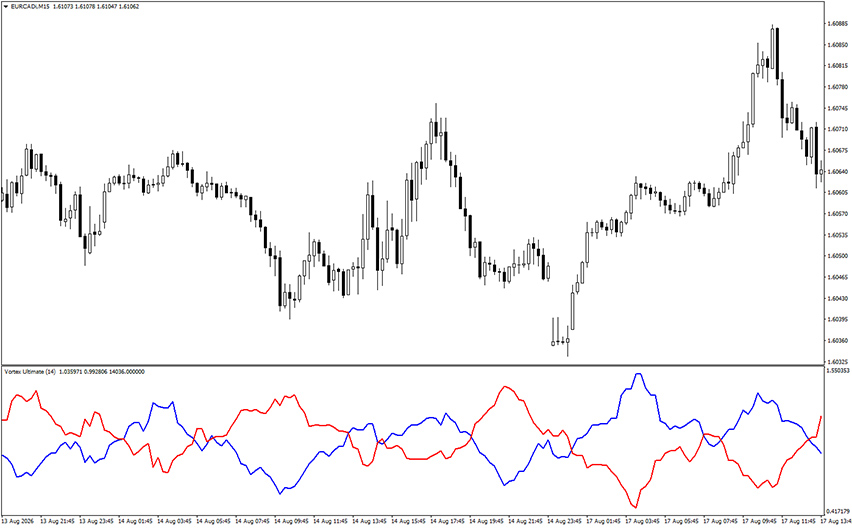
As you can see on the EUR/CAD M15 chart below, the lines swap places repeatedly.
Each crossover tends to line up with a genuine shift in the short-term trend. Blue taking over as price rallies and red taking over as price pulls back.
Reading line distance
The gap between the two vortex lines carries as much information as the crossover itself.
A wide gap signals a trend with real conviction behind it.
A narrow, tightly woven gap, visible in several stretches on the chart above, usually means the market is ranging and crossovers are more likely to be false starts.
Treating a crossover with a wide gap as a stronger signal than one where the lines are barely separated can help filter out weaker setups.
Bottom line
The Vortex Ultimate Indicator for MT4 works best in trending markets.
When the lines move further apart, it can provide an early visual signal. This suggests that momentum is building in one direction.
In quieter or range-bound markets, the frequent crossovers are less reliable, so leaning on line distance and outside confirmation is what separates a useful signal from noise.