Xmaster Formula Indicator MT4
Platform: MT4 Type: Trend Last update: September 12, 2026The Xmaster Formula Indicator for MT4 plots a series of colored dots below the price chart, along with buy and sell arrows, to generate clear trading signals.
It’s a popular trend-following tool designed to give traders a complete picture of the market.
It considers factors such as trend direction and strength while also identifying potential entry and exit points – all based on a formula that has earned a solid reputation among traders.
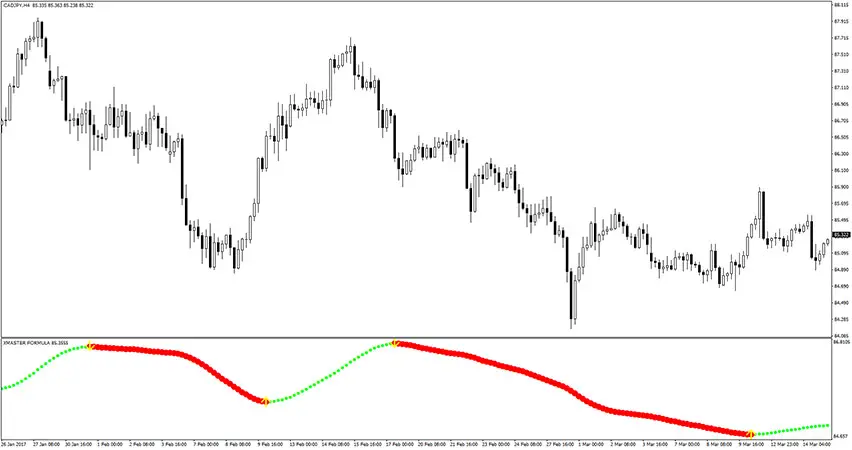
Example chart:

How to use the Xmaster Formula Indicator for MT4?
The anatomy of the Xmaster Formula Indicator is quite simple.
There’s a main signal line made of large, continuous dots running through the chart. It also uses color code to reflect trend direction: green for bullish, red for bearish.
Buy and sell arrows are layered on top, marking the exact moments to enter and exit trades.
One quirk worth noting: bearish segments appear visually thicker than bullish ones, though this is purely a design choice and doesn’t indicate a stronger signal.
Trade examples
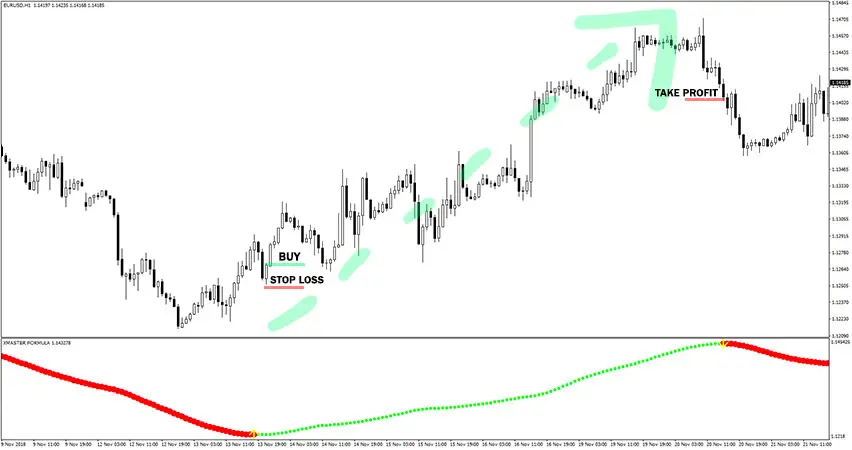
As you can see on the EUR/USD H1 chart above, the Xmaster Formula’s signal line switched from red to green with a yellow arrow marking the crossover. Price rallied steadily afterward.
The stop loss was placed just below the entry. Take profit was set more than 100 pips higher as the trend began to stall near the top.
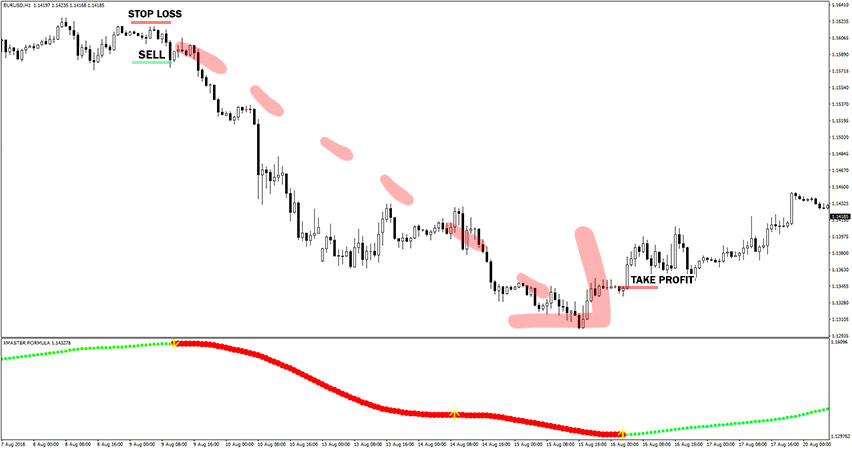
The second EUR/USD H1 chart shows the reverse setup. The line flipped from green to red, again marked by a yellow arrow, right as price turned lower.
Price fell for an extended stretch before finding support. The trade was closed out once the decline slowed and the line began curving back toward green.
In both cases, the Xmaster Formula’s arrow at the crossover point offered a clear, early entry, while the following move gave a wide enough runway for a solid risk-to-reward outcome.
Fun fact: it’s also called xhmaster formula
Over time, the indicator has also picked up a nickname xhmaster formula. This variation shows up in search results and forum discussions.
A note on “updated” versions
You’ll find many sites claiming to offer newer, updated versions of the Xmaster Formula, often with the current year tacked onto the name.
In reality, the core formula hasn’t changed, it was built solidly from the start and doesn’t need yearly revisions.
The version shared here is a stable, reliable build you can use with confidence.
Pairing Xmaster Formula with other technical indicators
The Xhmaster Formula works fine on its own, but combining it with a second tool can add useful confirmation.
Xmaster + Murrey Math Lines

Pairing it with Murrey Math Lines brings clear support and resistance levels into the picture, helping flag overbought and oversold extremes.
When a Murrey Math level lines up with an Xmaster Formula signal, that overlap adds an extra layer of confidence to the setup.
Xmaster + Supertrend
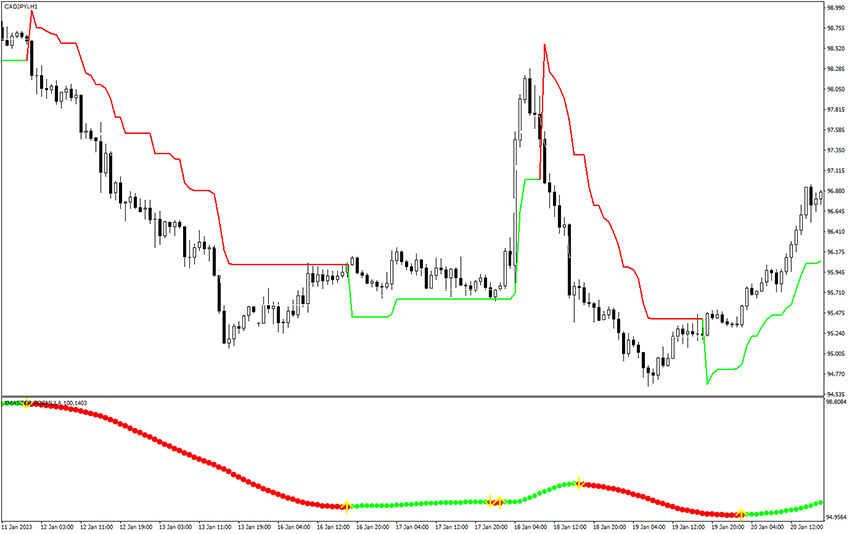
Pairing it with Supertrend works a bit differently. Most of the time, both indicators will agree, reinforcing the signal.
When they disagree, Supertrend acts as a filter. It helps to skip the occasional false signal from Xmaster Formula before it costs you.
Bottom line
The Xmaster Formula (Xhmaster Formula) Indicator makes price movements easier to understand by showing a simple red or green signal.
What’s more, it does not repaint. Once a dot or arrow appears, it stays there. This means the signals you see later are the same signals you would have seen in real time.
However, simple signals can sometimes be misleading. It’s easy to treat every color change as a reason to trade, but not every signal leads to a strong move.
That’s why it’s a good idea to use it in conjunction or broader market context.