ATR Bands Indicator
Platform: MT4 Type: Channel Last update: November 10, 2024The ATR Bands Indicator for MT4 is a combination of the Average True Range (ATR) with specific bands to assess market volatility. These outer bands can serve as levels of support and resistance in the market.
Introducing the ATR Bands Indicator
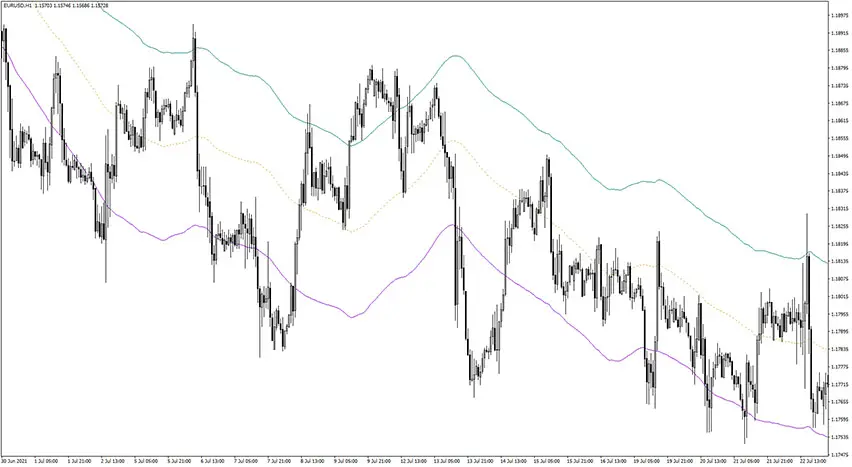
Please find the example chart below.
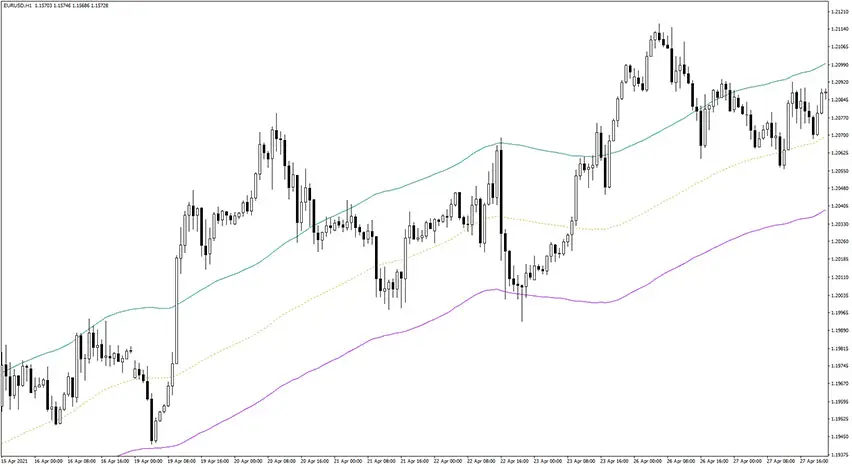
The indicator serves multiple purposes as an effective tool for detecting volatility, determining dynamic support and resistance levels, analyzing trends, and identifying potential trend reversals. It adjusts its size to indicate low or high volatility in the asset’s price.
While this indicator bears a resemblance to the well-known Bollinger Bands, it functions slightly differently. The upper and lower bands of the indicator represent the upper and lower price ranges. As a result, the bands are calculated based on the average true range of the price.
The ATR Bands indicator fundamentally depends on the average true range of the price to determine market volatility. Moreover, it assists in identifying favorable zones for entering and exiting trades. Its effectiveness surpasses that of traditional Bollinger Bands, thanks to the crucial contribution made by the ATR.
Additionally, this gauge is user-friendly and suitable for forex traders at all skill levels, ranging from beginners to intermediates and experts. Furthermore, it caters to various trading styles such as scalping, day trading, intraday trading, and swing trading.
Trading suggestions
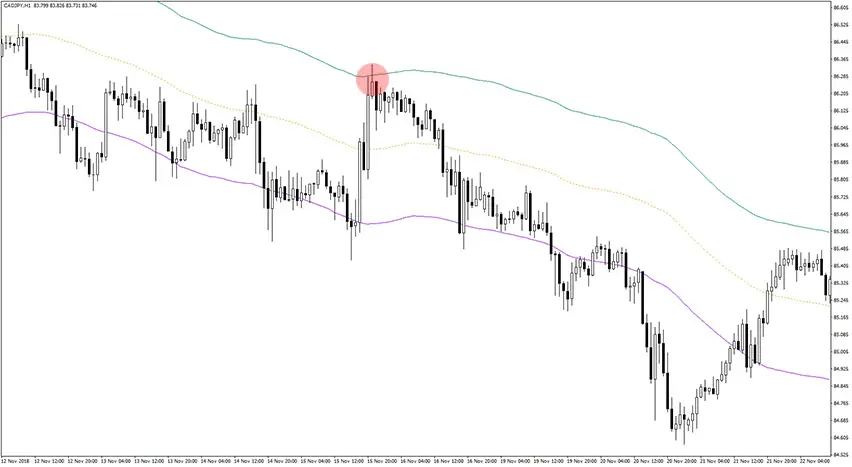
As you can see in the above chart, slope of the channel is clearly downwards. The price made made upward impulse but rejected the upper band and continued the downward movement.
It is advisable not to rely solely on the indicator but to use it in conjunction with price action and other technical indicators for optimal effectiveness.
BUY Signal: Begin by patiently waiting for the price to reach the lower band of the indicator. Then, observe for signs of price rejection towards the upside. When these conditions align, you may consider opening a BUY or LONG position. Additionally, confirm the bullish bias by looking for a bullish reversal candlestick pattern such as a bullish engulfing pattern.
SELL Signal: Start by patiently waiting for the price to reach the upper band of the indicator. Pay attention to any signs of price rejection towards the downside. When these conditions align, you may consider opening a SELL or SHORT position. Furthermore, confirm the bearish bias by identifying a bearish reversal candlestick pattern like a bearish engulfing pattern.
Conclustion
The ATR Bands indicator for MetaTrader 4 serves a dual purpose as both a measure of trend volatility and a tool for precise trade entry and exit points. The indicator stands as one of the most effective tools in a trader’s arsenal, particularly valuable for identifying trend reversals, gauging volatility. With its ability to assess market dynamics, the ATR Bands indicator empowers traders to make informed decisions based on the prevailing volatility levels.
Submit your review | |