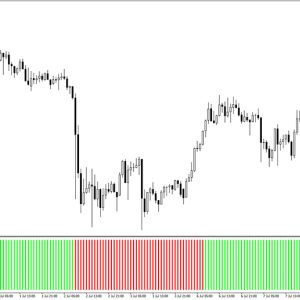
Trend Bands Indicator MT4
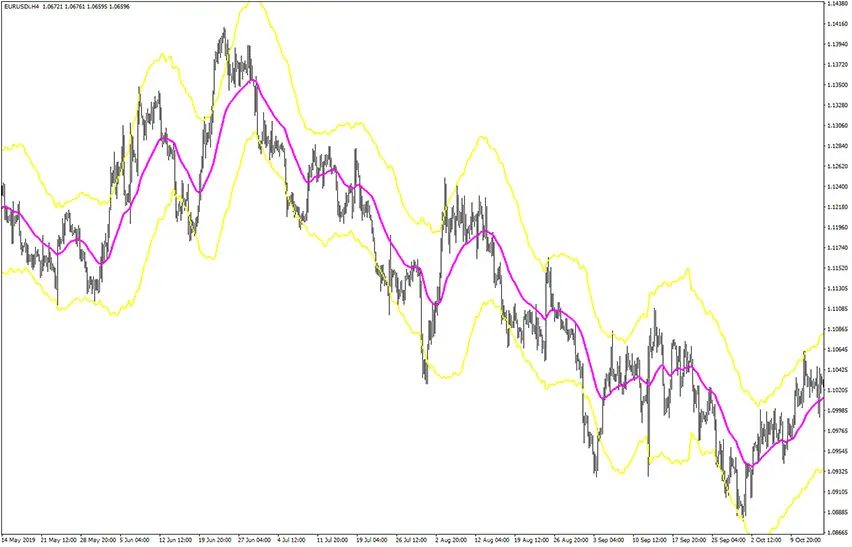
Platform: MT4 Type: Trend Last update: August 5, 2026The Trend Bands Indicator for MT4 plots two bands with a moving average in the middle, tracking trend direction and volatility.
The bands act as support and resistance, so when price touches them, you can expect a high-probability reaction. So these zones are good entry opportunities.
Example chart:
How to use the Trend Bands Indicator for MT4?
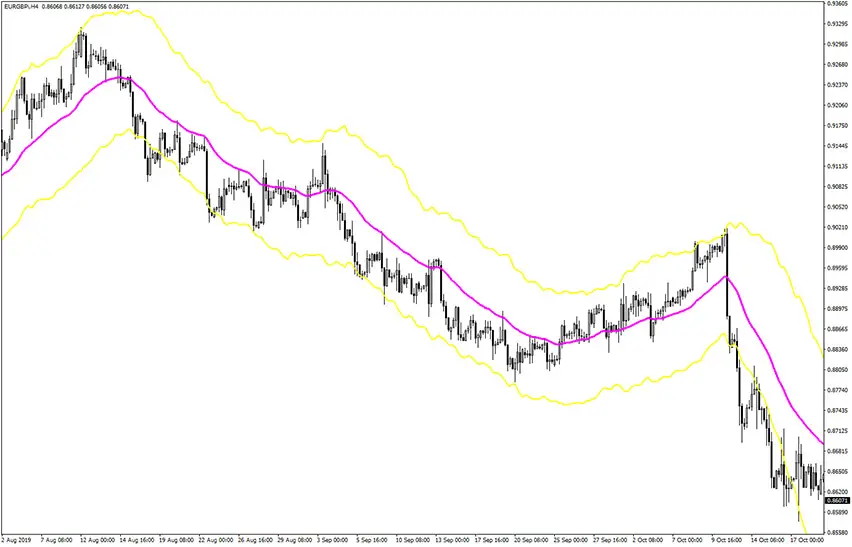
The Trend Bands indicator plots two yellow lines that form a channel, with a magenta line in the middle marking trend direction. When price sits below the magenta line, the trend is bearish. When price sits above it, the trend is bullish.
There are two main ways to trade this indicator: reacting to band touches (best in sideways markets) or trading pullbacks (best in strong trends).
Range-bound scenario
This works best when a currency pair is moving sideways, meaning price on the left side of the chart looks similar to price on the right, with no clear direction.
Enter a trade when price touches a band and shows a rejection pattern (like a pinbar).
Take profit at the middle line or the opposite band.
Strong bias scenario
This strategy works best during a clear, strong trend.
First confirm the trend is well established. Then wait for price to break outside the channel and pull back toward the magenta line.
If price rejects that level, enter in the direction of the original trend, since it’s likely to continue.
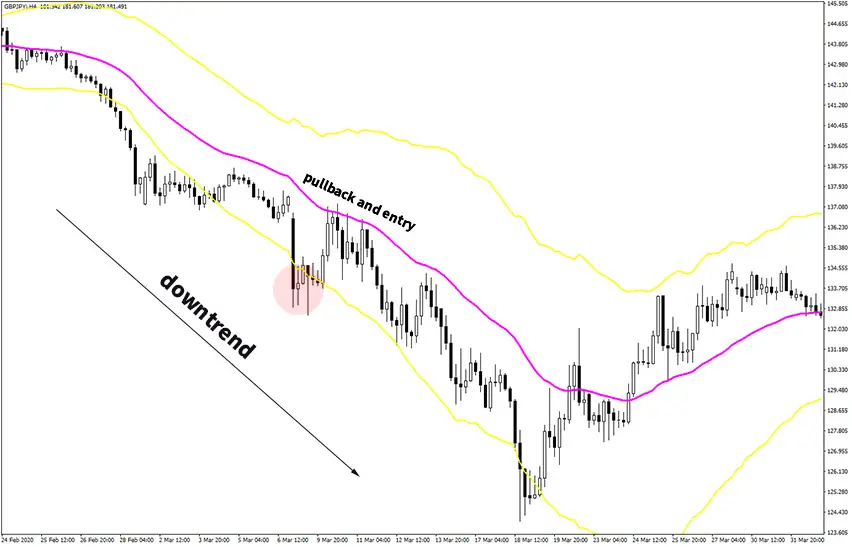
Here’s an example. On the above GBP/JPY H4 chart, price is in a strong downtrend.
After an extreme move (highlighted in the circle), price pulled back to the middle moving average without breaking through it.
Once the rejection was confirmed, the trade triggered, resulting in a strong risk-to-reward outcome.