Polynomial Regression Channel Indicator MT5
Platform: MT5 Type: Channel Last update: September 8, 2026The Polynomial Regression Channel Indicator for MT5 plots a dynamic channel that adjusts automatically to price volatility and curves along with the trend, rather than relying on a straight line like most channel indicators.
Example chart:

How to use the Polynomial Regression Channel Indicator for MT5?
The middle line does more than mark the center of the channel, its color signals trend direction: green for bullish and blue for bearish.
The upper and lower bands act as dynamic support and resistance. They double as overbought and oversold zones where price is more likely to reverse.
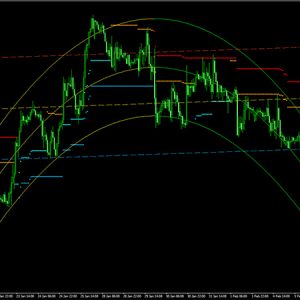
As you can see on the EUR/AUD H1 chart above, the Polynomial Regression Channel curves smoothly with price rather than following a straight path.
It arcs upward during the rally. It then flattens near the top. Finally, it curves back down during the extended decline that follows.
Trading the bands
The core strategy behind the Polynomial Regression Channel Indicator for MT5 is simple.
Look for a buy near the lower band and a sell near the upper band.
However, do not enter the trade as soon as price touches a band. Instead, wait for a rejection.
This can appear as a wick pushing into the band, followed by a candle closing back inside the channel. Once this happens, consider entering the trade.
This helps filter out cases where price simply breaks through the band and keeps moving.
Once in a trade, you can trail your stop loss toward the middle line as price moves in your favor, and take profit at the opposite band.