VWAP Bands Indicator MT4
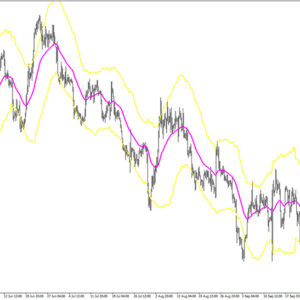
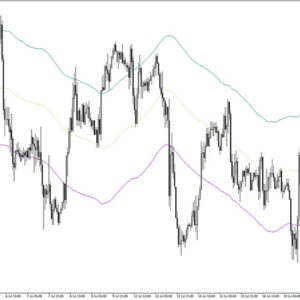
Platform: MT4 Type: Channel Last update: August 15, 2026The VWAP Bands Indicator for MT4 displays a channel with a white central line and several colored layers.
It looks similar to Bollinger Bands, but the central line here is calculated from the volume-weighted average price instead of a moving average.
The layered bands often mark useful entry zones.
Example chart:

How to use the VWAP Bands Indicator for MT4?
The trading strategy with the VWAP Bands Indicator relies on price returning to fair value, represented by the white central line.
Watch your charts closely and you’ll notice this pattern plays out often.
The indicator plots three layers on each side: red, green and blue – moving from tightest to widest. The best opportunities form when price rejects the outer blue or green band.
So, look for a price action signal (like a pin bar) to confirm the rejection. Once you confirm it, enter a trade and set your take profit at the middle line.
Take a look at USD/JPY H1 chart.

In one instance, price spikes below the blue band and quickly snaps back toward the white line.
Later, a similar move happens from the upside, price pushes above the band and reverts just as fast.
In both cases, price doesn’t stay outside the outer band for long before returning to fair value, which is exactly the behavior this strategy is built to capture.