Trend Sentry Indicator MT4
Platform: MT4 Type: Trend Last update: August 31, 2026The Trend Sentry indicator for MT4 is a trend-following tool that shows a colored line. It switches color to signal shifts between trend and pullback phases, regardless of overall market direction.
It also displays clear signal labels so you know which way to trade.
Example chart:
How to use the Trend Sentry Indicator for MT4?
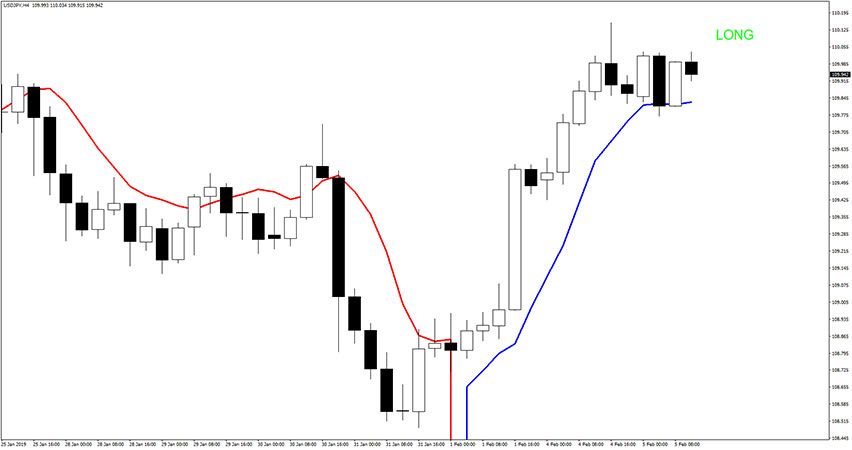
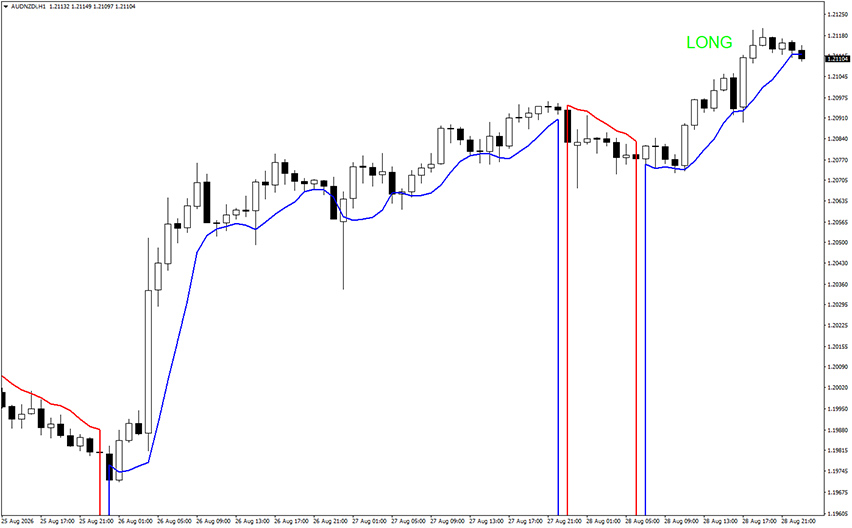
The Trend Sentry Indicator consists of just two lines, blue and red, so its signals are easy to follow. Each colored segment starts and ends with a vertical line, marking exactly where one phase ends and the next begins.
Blue signals bullish momentum, red signals bearish momentum and a “LONG” or “SHORT” label in the top right corner confirms the current bias.
For a buy entry, open a long trade when the line turns blue. Place your stop loss a few pips below the last swing low.
For a sell entry, open a short trade when the line turns red. Similarly, place your stop loss a few pips above the last swing high.
In both cases, close the trade once the opposite signal appears or exit using your own preferred method.

As you can see on the GBP/USD H4 chart above, the Trend Sentry line switches from blue to red right as price tops out. There is a vertical marker and the “SHORT” label confirming the shift.
Price then trends steadily lower for the rest of the chart, tracking below the red line throughout the move.