VWAP Bands Indicator
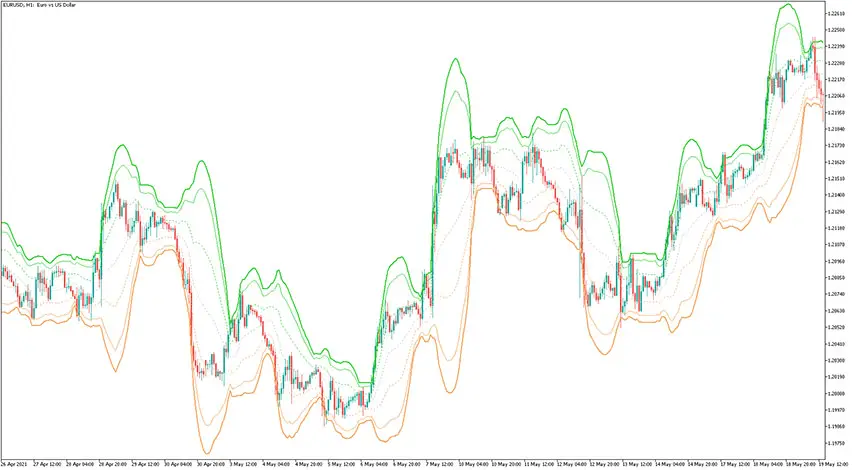
Platform: MT5 Type: Channel Last update: September 24, 2024The VWAP Bands Indicator for MetaTrader 5 is similar to the Bollinger Bands, but to calculate its values it uses Volume-Weighted Average as the central value of the bands. Additionally, you can choose an option to use the tick volume or real volume for calculation (only in the case, if the symbol and the broker are having real volume at all). What’s more, you can choose to have deviations calculated with or without sample correction.
How to apply VWPA bands in trading?
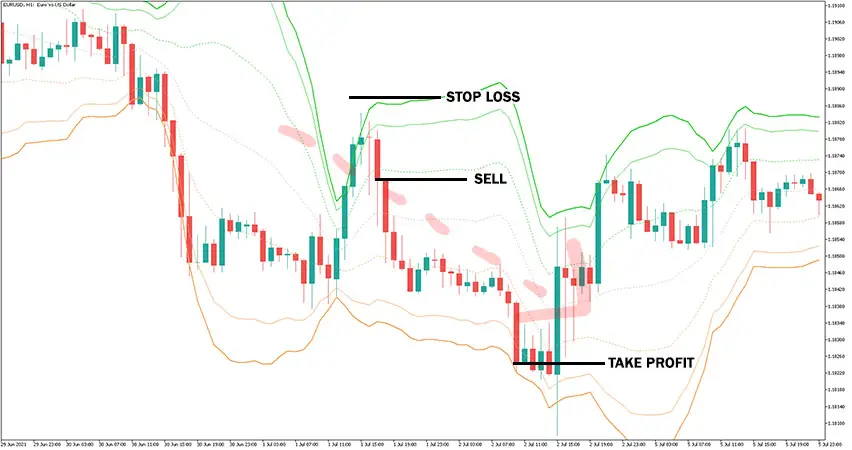
As you can notice, VWAP Bands Indicator displays three bands to each side. Each of the bands can be turned on or off. If the deviations multiplier for any of the bands is set to zero, then that bands are not going to be calculated. Check these general instructions for trading with that VWAP Bands indicator.
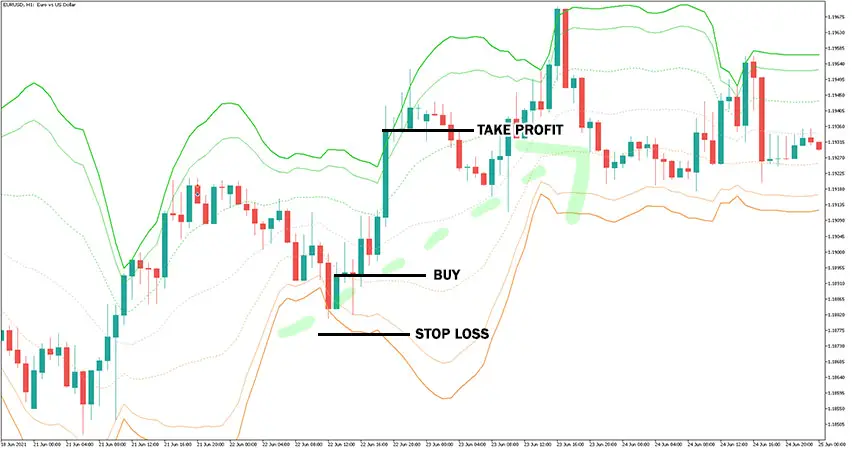
Buy Signal
Follow these steps for a long trade:
- General trend is bullish
- Price touches lower outer band (thick orange line)
- Price rejects that level and swings higher from recent low swing
- Buy trade is triggered after the first candle meeting above conditions
- Set stop loss a few pips below the last swing low of the market
- Take profit or exit whenever the price tocuhes opposite band or use your own method of trade exit
Sell Signal
Follow these steps for a short trade:
- General trend is bearish
- Price touches upper outer band (thick green line)
- Price rejects that level and swings lower from recent high swing
- Sell trade is triggered after the first candle meeting above conditions
- Set stop loss a few pips above the last swing high of the market
- Take profit or exit whenever the price tocuhes opposite band or use your own method of trade exit