ADX Trend Indicator
Platform: MT4 Type: Channel Last update: September 26, 2024The ADX Trend Indicator for MT4 is a forex price channel based on the Average Directional Index and it’s available to free download. Its bands work as dynamic overbought and oversold levels delivering potential market entry points. What’s more, its slope comes in handy in determining the trend direction.
Technical analysis is pretty easy with that forex indicator. Let’s take a closer look at it and bring some practical trading examples.
Adx trend in channel trading
It’s a fact that the price oscillates up and down as market participants react to overbought and oversold price states, therefore smart traders would want to capture these reversals by identifying extreme price levels which essentially are market turning points.
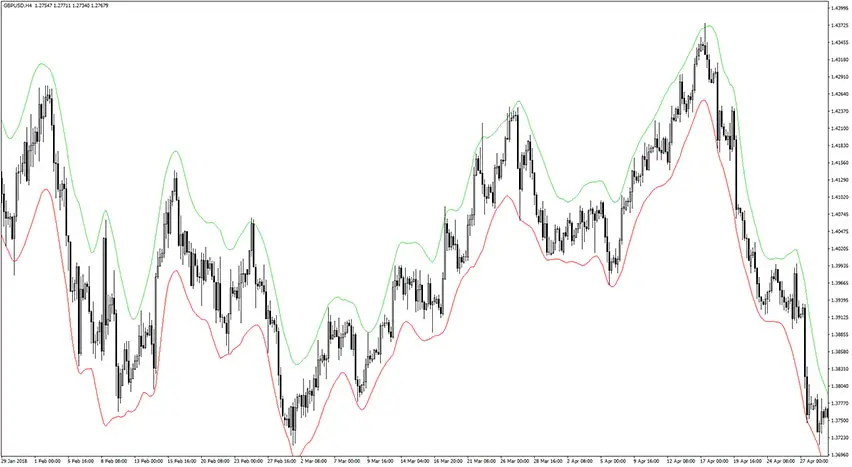
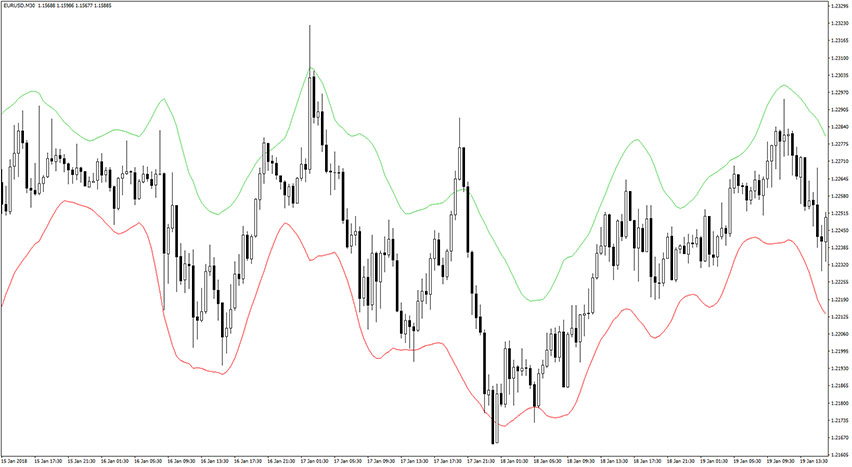
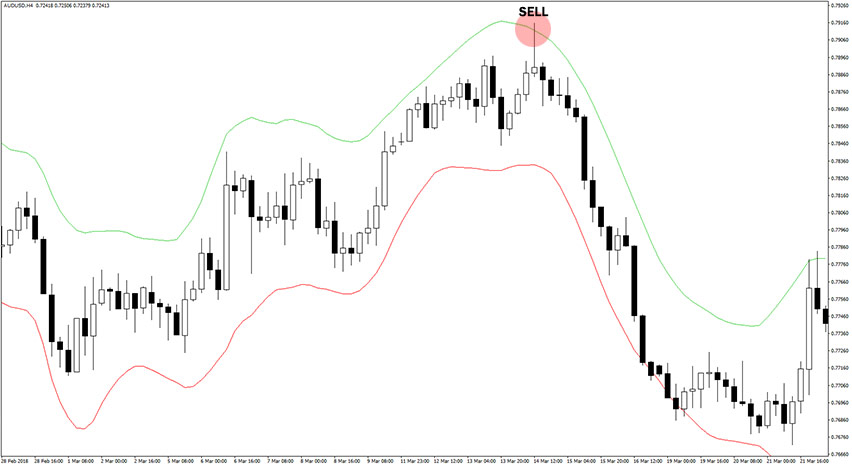
The ADX Trend is a channel type of forex indicator working in a similar manner to the Bollinger Bands or Keltner Channel. That gauge draws a smoothened channel-like structure that envelopes the candlesticks. Its upper band is color green, while its lower band is color red. Most of the time, the price doesn’t touch these bands, but when it does, it is an indication of reaching an extreme level, thus it is a trade-triggering signal.
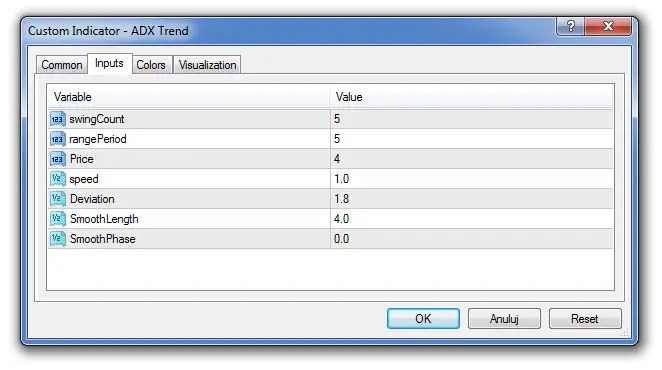
ADX Trend Indicator Settings
There are a few variables you can customize, including the “Swing Count”, “Range Period”, “Price”, “Speed”, “Deviation”, “Smooth Length”, and “Smooth Phase” in order to adjust the sensitivity, smoothness, and width of the ADX Trend Indicator.
How To Trade With The ADX Trend Indicator?
Generally speaking, the signal trigger is based on the price reaching the extreme zones and expecting it to return to the mean. Let’s deep dive into how to exactly use that forex indicator in a few simple steps.
Buy Signal
- Price hits the lower lower band
- Triggering candle forms a rejection pattern
- Open long trade when the above conditions are met
- Set stop loss a few pips below the most recent market’s low point
- Take profit whenever the indicator touches the opposite band or close it after achieving a satisfying risk-to-reward ratio

Sell Signal
- Price hits the upper lower band
- Triggering candle forms a rejection pattern
- Open short trade when the above conditions are met
- Set stop loss a few pips above the most recent market’s high point
- Take profit whenever the indicator touches the opposite band or close it after achieving a satisfying risk-to-reward ratio
Conclusion
We find ADX Trend Indicator as one of the best forex indicators of its kind. Its signals are quite rare but very reliable. By default, its formula uses a standard deviation of 1.8 with a 5-day range count period, making it a great fit for short-term and intraday technical analysis purposes.
To increase the success rate even more, one should be familiar with candlestick patterns, especially reversal patterns like Pin Bars. It can be also a great foundation for developing your own profitable trading strategy.