Author: admin
Multi Time Frame Breakout Indicator
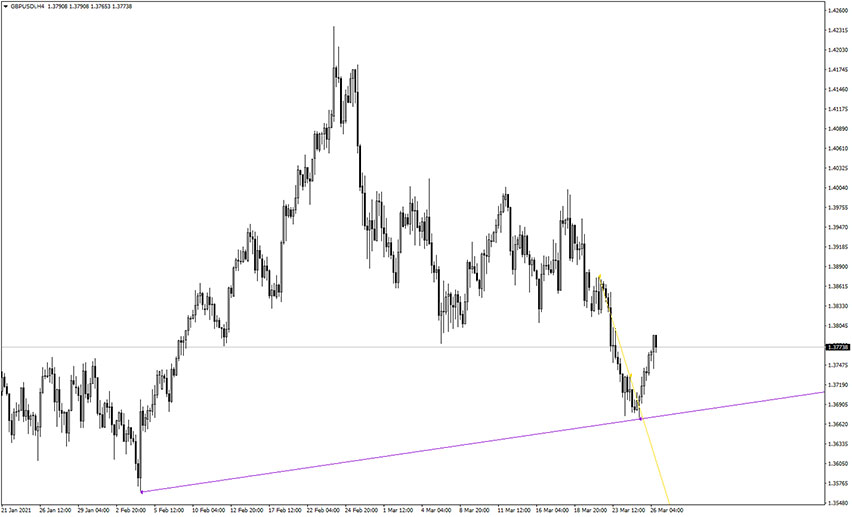
The Multi Time Frame Breakout indicator is, as the name suggests, a forex trading tool that utilizes a breakout strategy. The indicator displays two trendlines – once the price breaks one of them, a trader should open a trade according to the breakout direction. Free Download
Tidane Trend Indicator

The Tidane Trend indicator determines whether the trend is bullish or bearish. The signals are represented in a form of the one side band (upside/downside), which consists of multiple dots connected by a line. Simplified trading rules for Tidane Trend are the following: Open buy trade when the Tidane Trend turns green. Set your stop […]
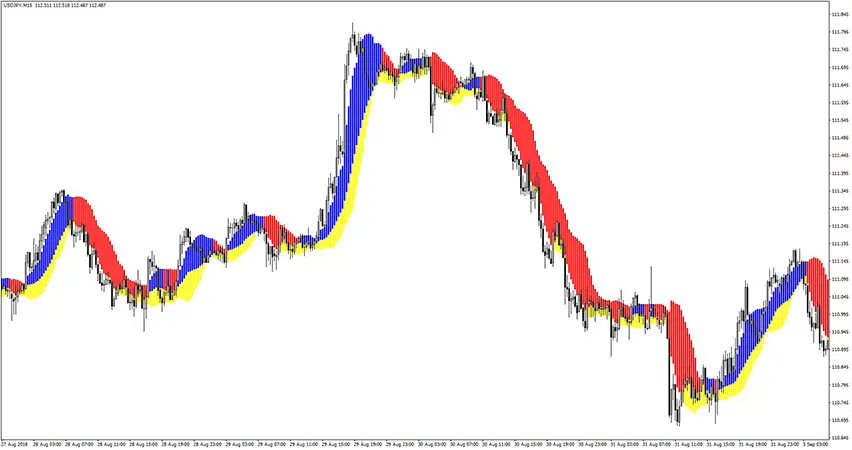
Heiken Ashi Exit Indicator

The Heiken Ashi Exit indicator falls into the trend-following category of forex indicators. It is basically a combination of a Moving Average and a Heiken Ashi Bars. Simplified trading rules for Heiken Ashi Exit are the following: Open buy trade when the HAE turns green and the overall market trend is clearly bullish. Close the […]
Traders Dynamic Index (TDI) Indicator
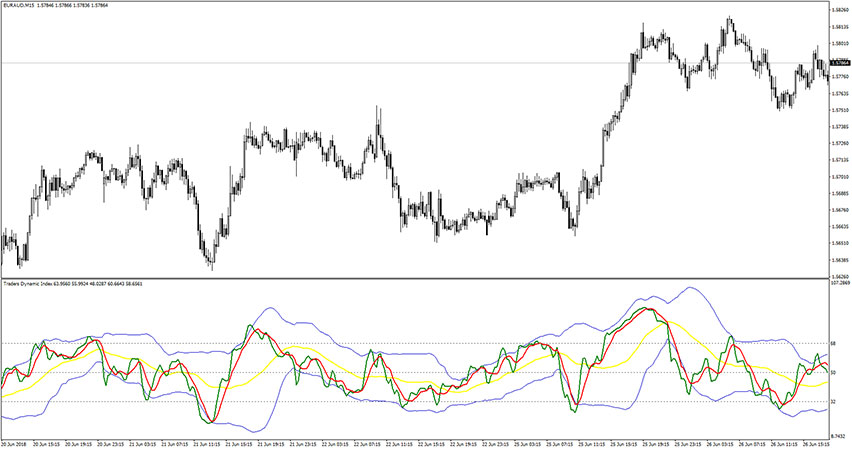
The Traders Dynamic Index indicator first appeared in the early 2000s. It was originally created by Dean Malone. At the first glance, it may look a bit complex, but the TDI is simply the result of combination of four following forex indicators: RSI (green line); Moving Average for signals (red line); Bollinger Bands with a […]
RSIMA Baseline Divergence Arrows Indicator
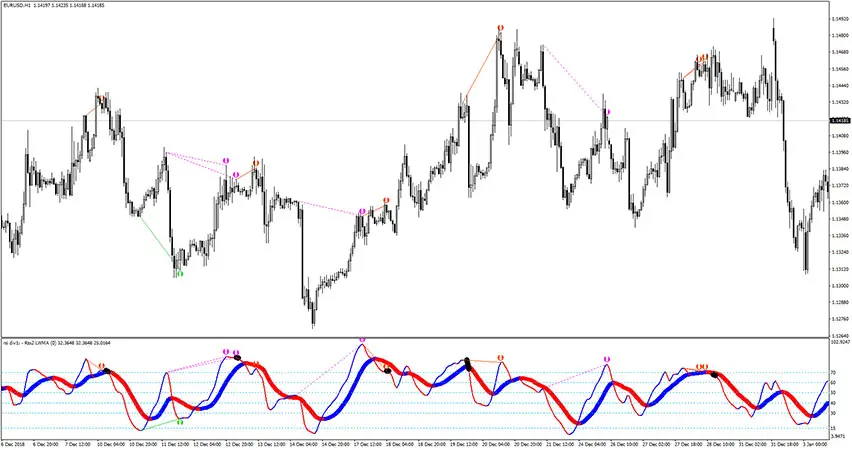
The RSIMA Baseline Divergence Arrows indicator works great at filtering those divergence signals. Divergences are only visible on this indicator if: If RSI MA is outside 80 Overbought, Bearish Divergence signal will appear (to forecast a reversal to the downside); If RSI MA is outside 20 Oversold, Bullish Divergence signal will appear (to forecast a […]
Forex Profit Boost Indicator
The Forex Profit Boost indicator is a trend-following tool, that can be also used as a reversal indicator. With the help of that gauge, you will easily know when the new trend is starting and when the current one is ending. The best results with the indicator you will get during strong trending market conditions, […]
Entry Points Pro Indicator
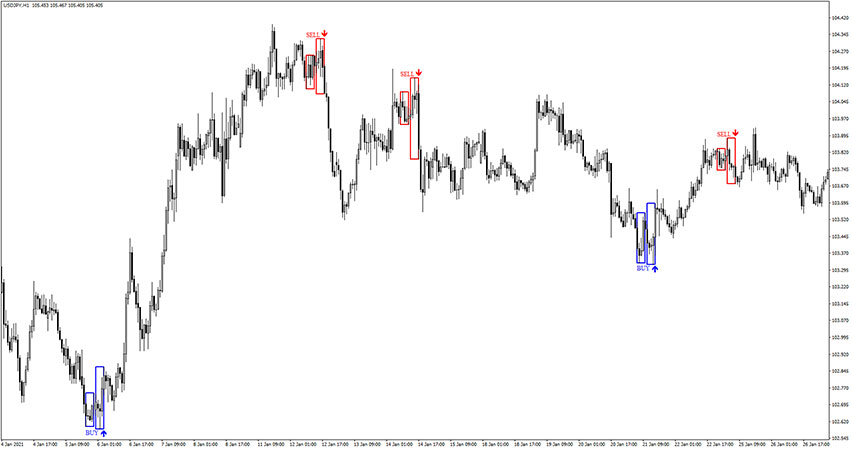
The Entry Points Pro indicator provides accurate signals to enter a trade and it does not redraw the signals (no repaint indicator). When this gauge recognizes reversal opportunity it marks candles in a rectangle. After that, a buy/sell arrow will appear. The signal is only valid after arrow occurrence. That indicator could be a great […]
Zee Zee Alert Indicator
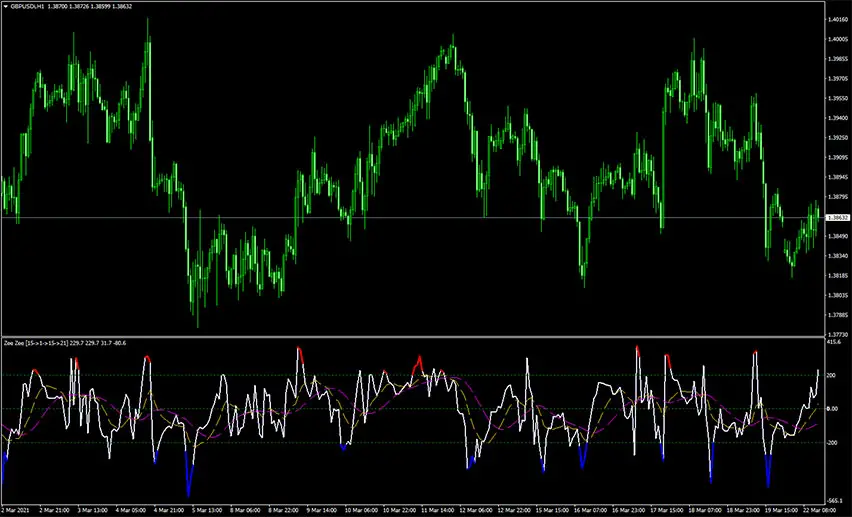
The Zee Zee Alert indicator is based on Commodity Channel Index (CCI) swing trading tool. It recognizes the overbought/oversold states of the market. There is also a crossover signal system for filtering its own trade signals. How to interpret the zee zee readings? Signals provided by the Zee Zee Alert Indicator may look complex at […]
Demark V1.01 Indicator
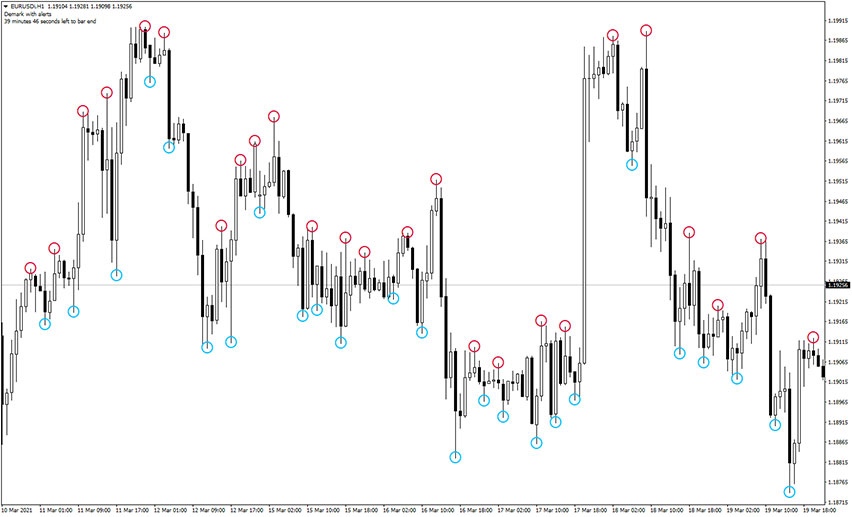
The Demark V1.01 indicator is a technical analysis tool that is used to predict short-term price action based on changes in intra-day highs and lows. It’s a handy gauge to time market entry points and exit points. Additionally, in the top left corner of the chart you will find time left for current candle to […]
Elliott Wave Oscillator Indicator
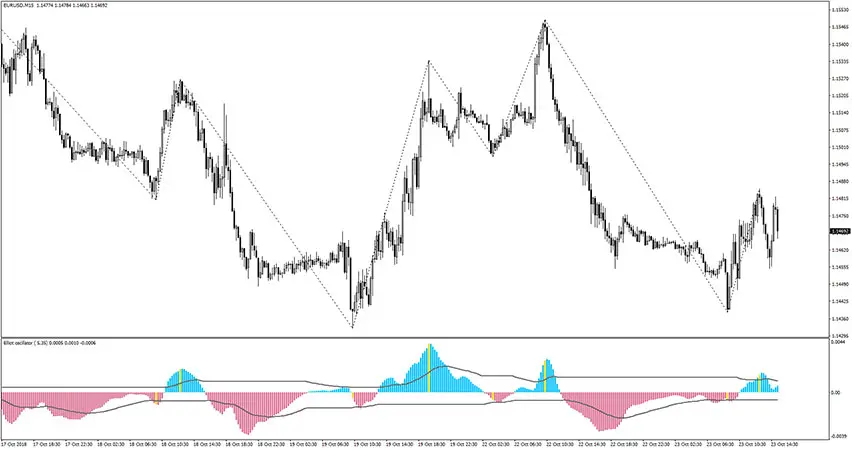
The Elliott Wave Oscillator indicator technically is the difference between a 5-period and 35-period simple moving average (SMA) based on the close of each candlestick. It’s helpful in determining where an Elliott wave ends and a new one starts. In other words, determining when the market price movement changes its direction (a reversal point) to […]