Breakout Trading Indicator MT4
MT4 Market Levels TradingFree DownloadThe Breakout Trading Indicator MT4 stands out as a preferred option for those engaged in breakout trading. This remarkable tool effectively identifies daily, weekly, and monthly price levels where breakouts occur. It proves particularly advantageous for individuals involved in forex and stocks trading. Free download is available.
Sounds interesting? Let’s take a closer look at it.
Breakout Trading Indicator: Introduction
MT4 Indicator Overview
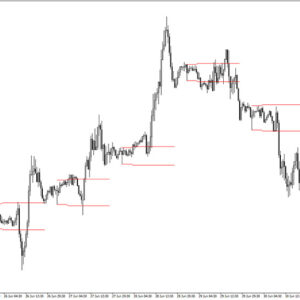
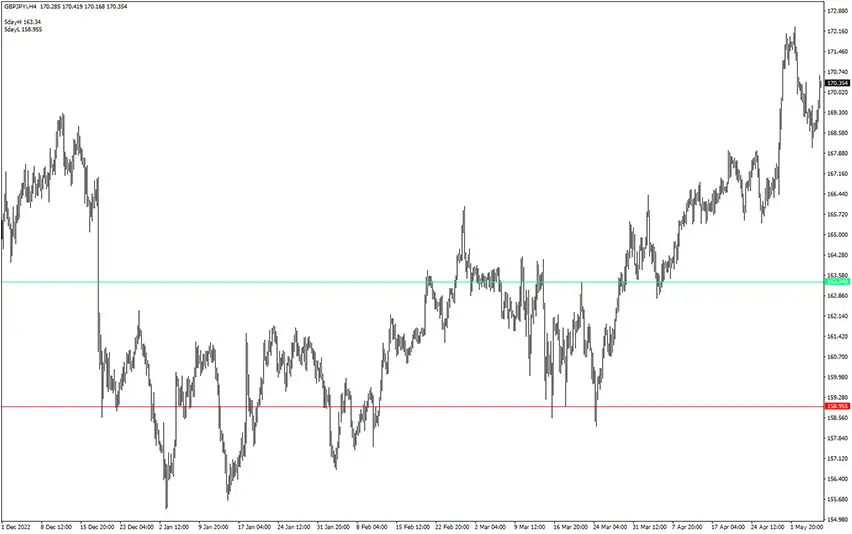
The download link of the Breakout Trading MT4 indicator is placed at the bottom of this post – once you’re done, your Metatrader 4 trading chart should look similar to the example below.
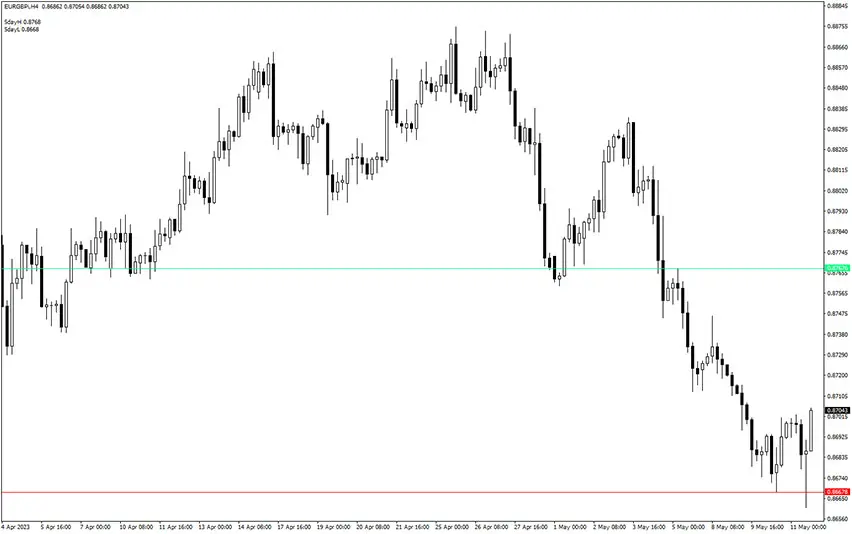
The Breakout indicator accurately establishes the upper and lower price boundaries within the chosen time frames. These extreme points, representing the market’s highs and lows, are recognized as robust breakout levels for prices. Whether the forex market exhibits a trending or sideways movement, this indicator enables you to consistently identify optimal buy and sell levels for breakouts.
Proactive traders employ breakout trading strategies to capitalize on early-stage market trends. Moreover, substantial price movements often occur following the breakthrough of robust support or resistance levels. Hence, such strong price breakouts also present lucrative opportunities for scalpers seeking rapid profit generation.
Forex Trading Suggestions
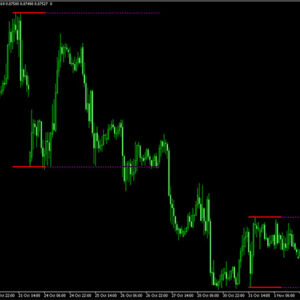
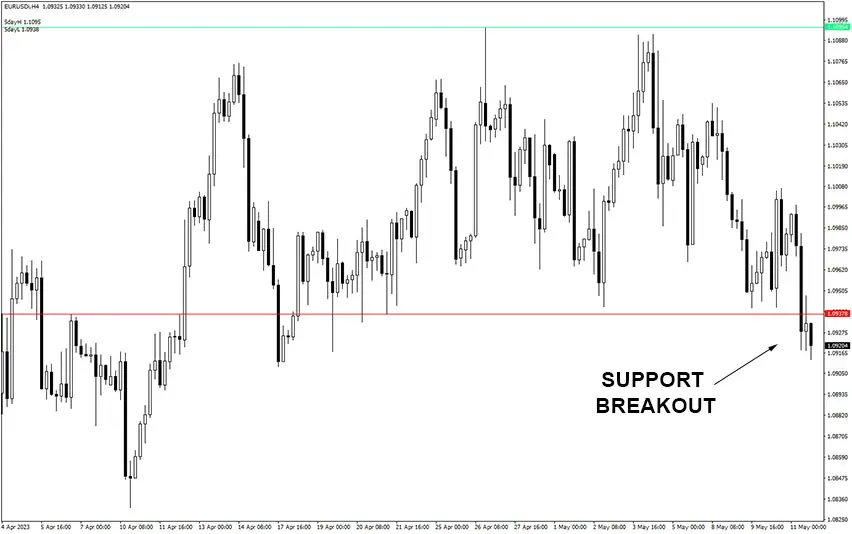
By default, this indicator utilizes the high and low of the past five days to plot support and resistance lines. The resistance level is represented by a green horizontal line, while the support level is indicated by a red line. The buy/sell entry strategy based on this indicator is straightforward: initiate a long position when the price breaks above the green line, and conversely, go short when the price breaks below the red line.
However, it is essential to identify forex price-action signals to gauge how the price behaves after reaching potential breakout zones. Merely touching a support or resistance line does not guarantee a successful price breakout. Therefore, it is imperative to observe a price-action signal before considering a price breakout as a valid trading opportunity.
For example, when one or multiple bullish candles close above the resistance line, it signifies a successful breakout of the resistance level. In such situations, it becomes favorable to seek buying opportunities following the bullish breakout.
False Breakouts
However, there are instances when the price may produce a false breakout at support or resistance levels. During such conditions, it is advisable to search for breakout opportunities in the opposite direction of the current price movement. For example, if there is a false break at the resistance level, it suggests that the price is likely to test the current support and potentially initiate a bearish breakout instead.
MT4 Indicators: Download and Installation Instructions
Download the Breakout Trading Indicator MT4.rar archive at the bottom of this post, unpack it, then copy and paste the breakout-trading.ex4 or breakout-trading.mq4 indicator files into the MQL4 folder of the Metatrader 4 trading platform.
You can gain access to this folder by clicking the top menu options, which goes as follows:
File > Open Data Folder > MQL4 > Indicators (paste here).
Now go to the left side of your MT4 terminal. In the Navigator find the gauge name, right-click it and select Attach to the chart.
Indicator Summary
The MT4 Breakout Trading indicator for MetaTrader undoubtedly presents an enticing choice for scalpers and intraday traders. With a successful breakout entry, you have the opportunity to capture a market trend at its early stage and aim for a more favorable profit margin ratio. In this regard, the breakout indicator assumes a crucial role by consistently defining automatic support and resistance levels. Furthermore, its straightforward identification of potential breakout levels provides an additional advantage for beginners, simplifying their trading approach.
Free Download Forex Breakout Trading MT4 Indicator
To download the Breakout Trading Indicator for Metatrader 4 (MT4) for free just click the button below:
Breakout Trading Indicator Free Download
