Category: Channel Indicators
Traders Dynamic Index (TDI) Indicator
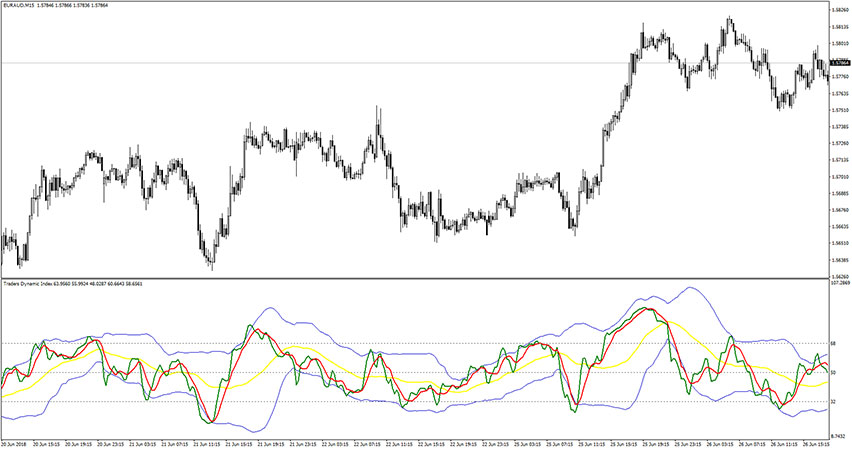
The Traders Dynamic Index indicator first appeared in the early 2000s. It was originally created by Dean Malone. At the first glance, it may look a bit complex, but the TDI is simply the result of combination of four following forex indicators: RSI (green line); Moving Average for signals (red line); Bollinger Bands with a […]
Intraday Channel Breakout Indicator
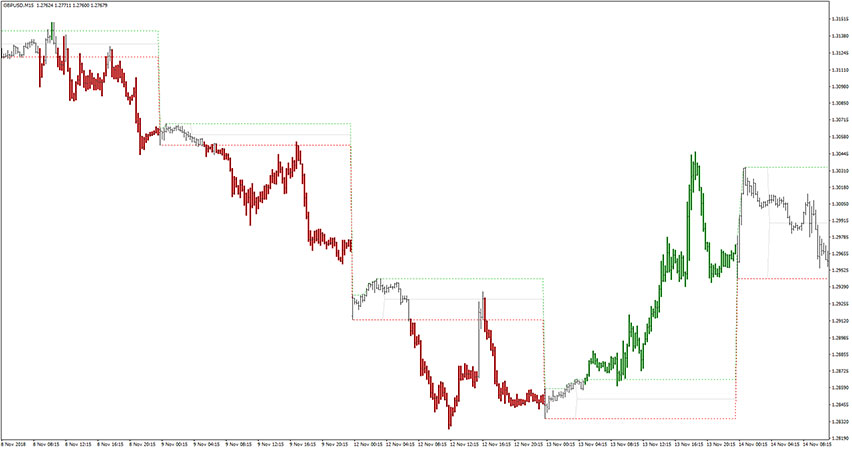
The Intraday Channel Breakout Indicator is an awesome trading tool for scalpers and intraday traders. As the name suggests, the main concept behind that gauge is to utilize breakouts and ICB does a great job at spotting them. Additionally, it colorizes candles to green or red, depending on breakout direction. How to apply the intraday […]
Trend Channels Indicator
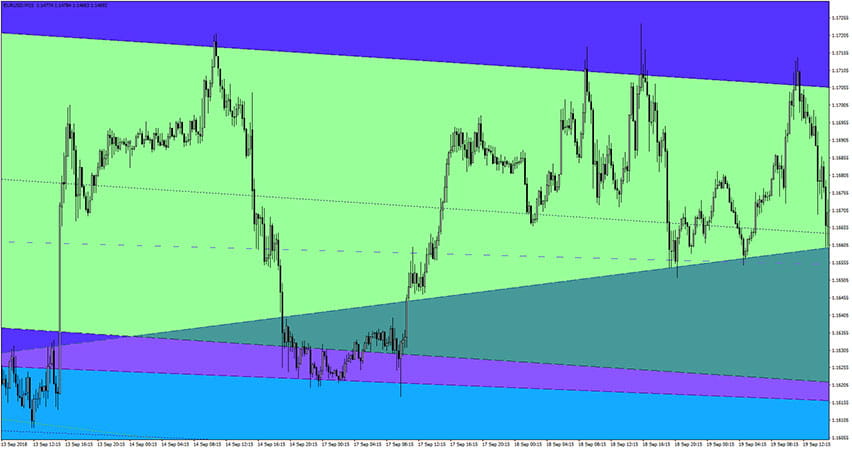
The Trend Channels indicator is a custom forex tool that plots colorful trend channels directly on the main trading chart. You should look for buy opportunities when price reacts from lower trendlines, and similarly, you should look for sell opportunities when price reacts from upper trendlines. This indicator places a lot of channels and it […]
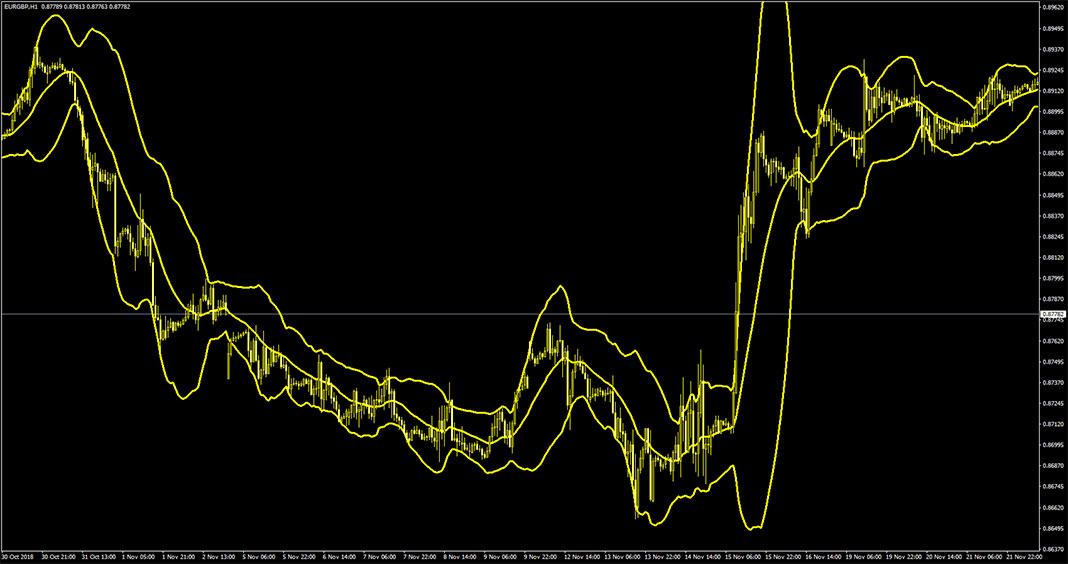
P Channel Indicator
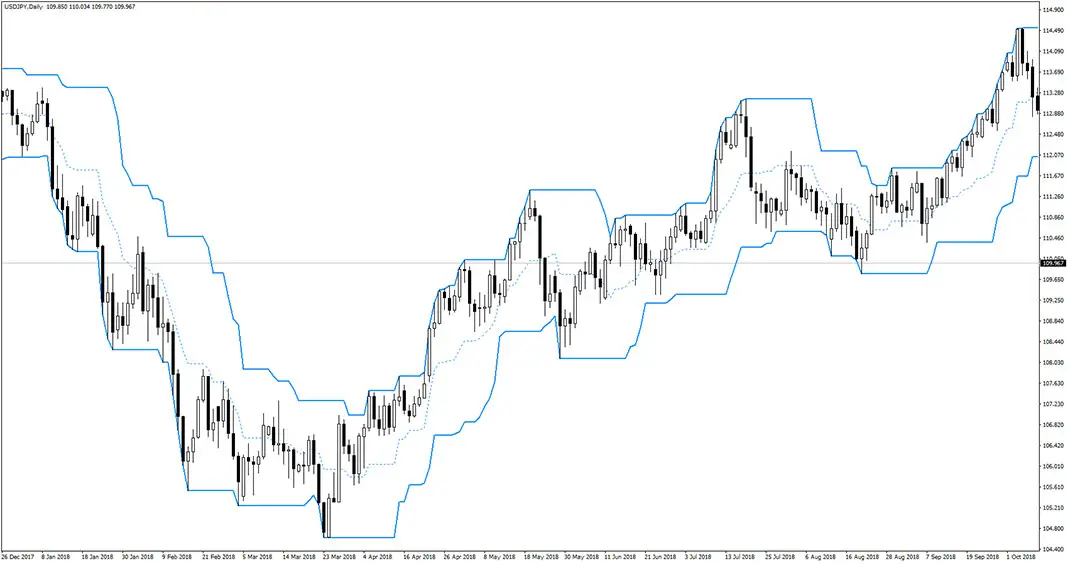
The P Channel Indicator is a custom forex technical analysis tool that consists of three elements: the mid-line and the two channel lines. When it comes to understanding the basic trading rules with this one, it is pretty straightforward. Simply look for buy opportunities when the price is above mid-line and look for sell opportunities […]
Dynamic Zone RSI Indicator
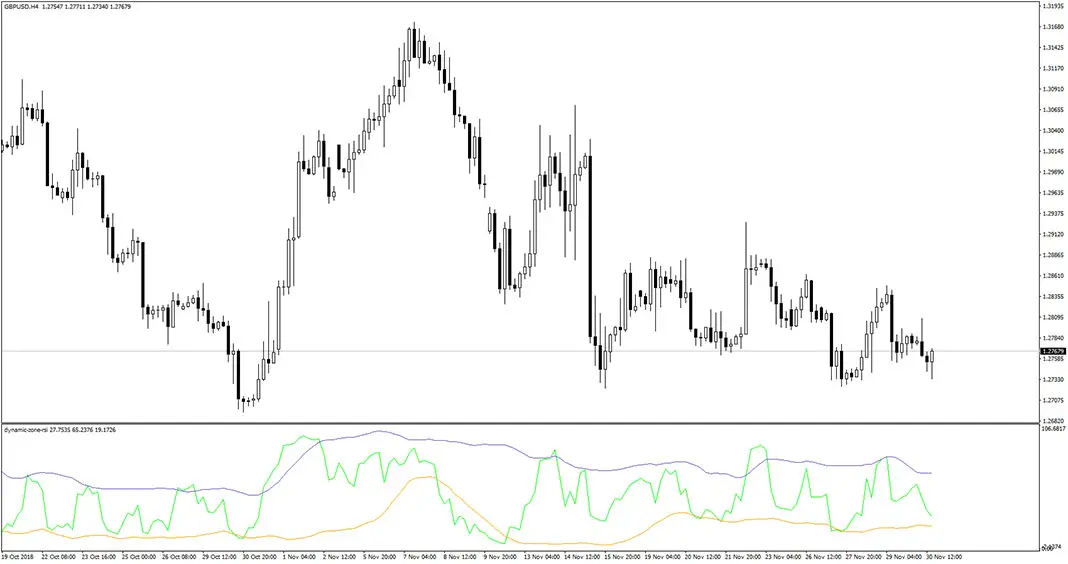
The Dynamic Zone RSI Indicator for MT4 is a forex technical analysis tool that combines RSI and two floating bands. The bands act in a similar manner to support and resistance. The purple band acts as a resistance level, while the orange band acts as a support level. You should look for buy trades when […]
Visual MACD Indicator
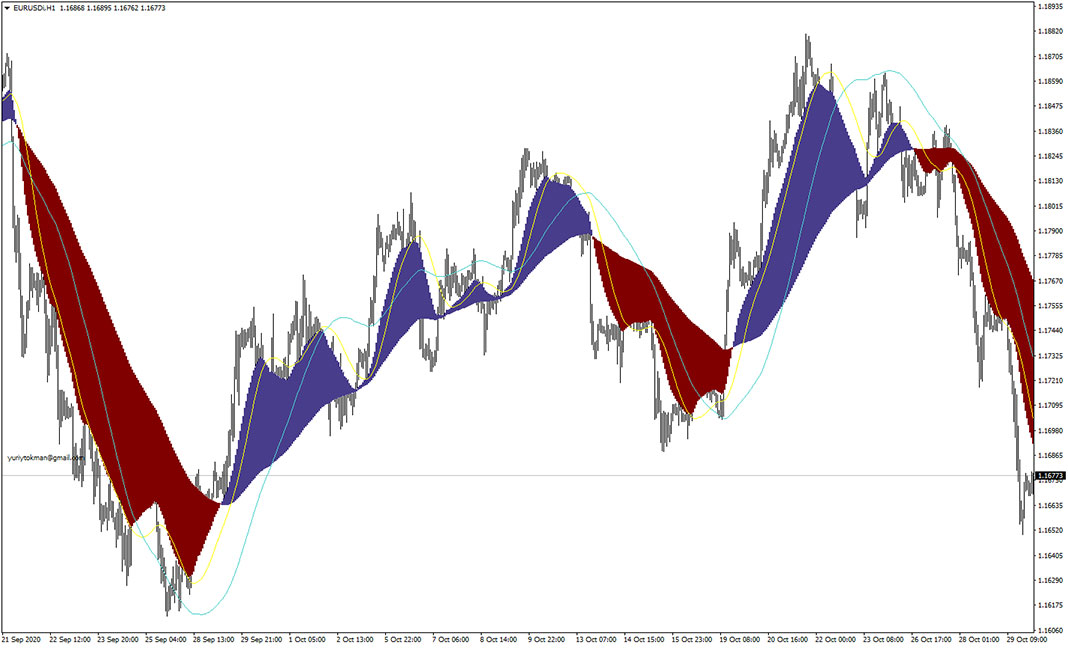
The Visual MACD Indicator is a forex technical analysis tool based on Moving Average Convergence Divergence, but it is plotted directly on the main trading chart. It is a short-term trend following indicator. You should look for buy trades when the MACD wave is blue. Similarly, you should look for sell trades when the MACD […]
Bands Q Indicator
The Bands Q Indicator is a custom forex trading tool that works in a very similar manner to the Bollinger Bands. We suggest to use it as a filter for opening and exiting transactions. Go ahead and add it to your best trading system. Free Download
Starc Bands Indicator
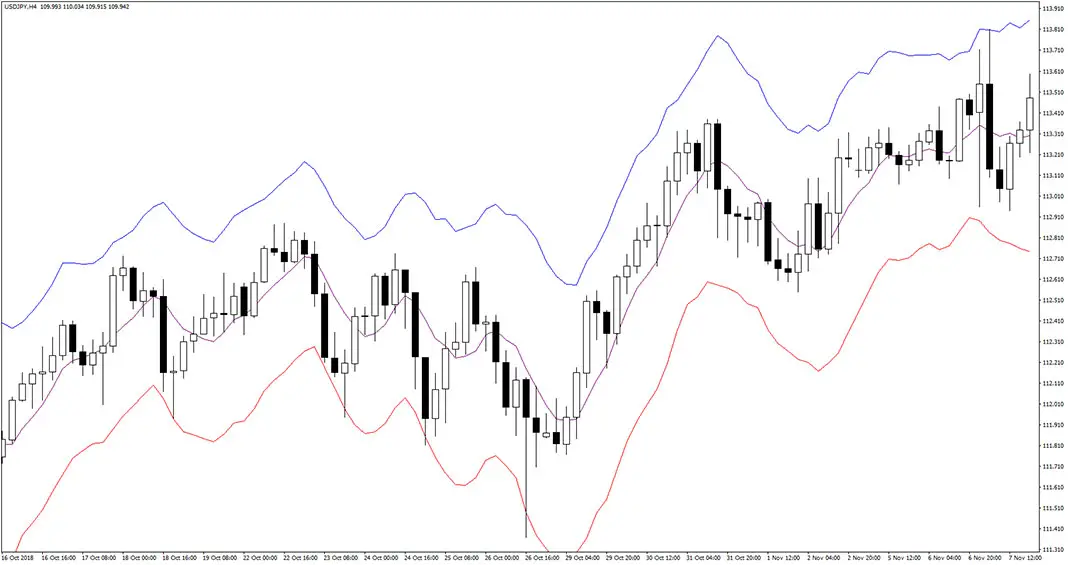
The Starc Bands Indicator means Stoller Average Range Channels Bands indicator. In fact, it works in a similar manner to the Bollinger Band. The upper and lower bands are calculated around a simple moving average to predict price movement. A price swing to the upper band means potential pullback towards the central moving average, and […]
Asymmetric Bands Indicator

The Asymmetric Bands Indicator is a custom forex tool that works in a similar manner to the Bollinger Bands, but there is a meaningful difference. This indicator uses asymmetric bands instead of equidistant ones. When the price is above average, then the lower band is narrowed. Similarly, when the price is below average, then the […]
TMA Trace MTF Indicator

The MA Trace MTF Indicator for MetaTrader 4 is a powerful tool that combines the Average True Range (ATR) and Moving Average (MA) to provide valuable insights into forex market trends and dynamic support or resistance levels defined by these TMA bands. The TMA Trace is especially beneficial for novice traders due to its user-friendly […]