Category: Momentum Indicators
Laguerre Histogram Indicator
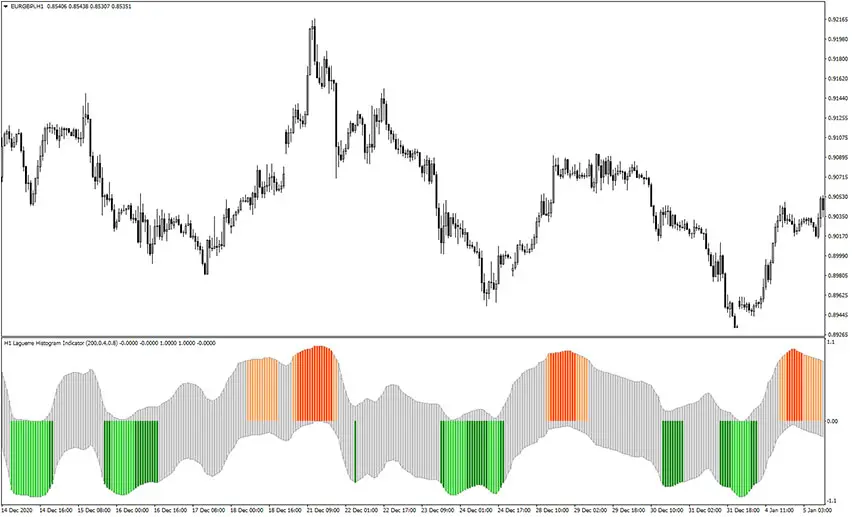
The Laguerre Histogram indicator, as the name suggests, displays Laguerre Oscillator signals in a form of the histogram bars, but also in an unusual way. These histogram bars are plotted into some kind of channel. Generally speaking, green bars represent an oversold market state and opportunity for a long trade (buy). Similarly, red bars represent […]
ATR Multi Time Frame Indicator

The ATR Multi Time Frame indicator is a custom forex trading indicator that displays rising and falling histogram bars. This is the multi-timeframe tool. It means you can choose if you want to receive signals from the current timeframe or higher. For example, you can use hourly TF for entries, but use daily TF for […]
2Line MACD Indicator
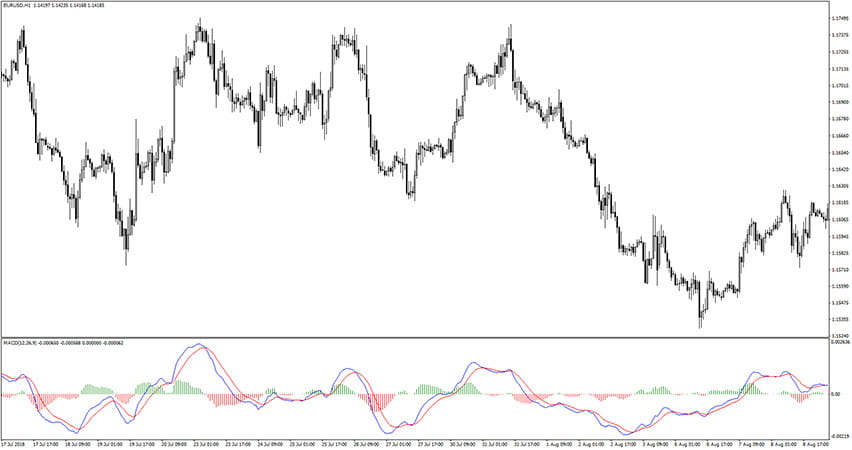
The 2Line MACD Indicator is an improved and updated version of the standard MetaTrader 4 MACD oscillator. How to use 2line macd? First, you need to determine the overall market trend. You can use trendline or moving average for that purpose. More advanced traders can utilize bounces from supply and demand or pivot levels. The […]
MA Momentum Arrows Indicator
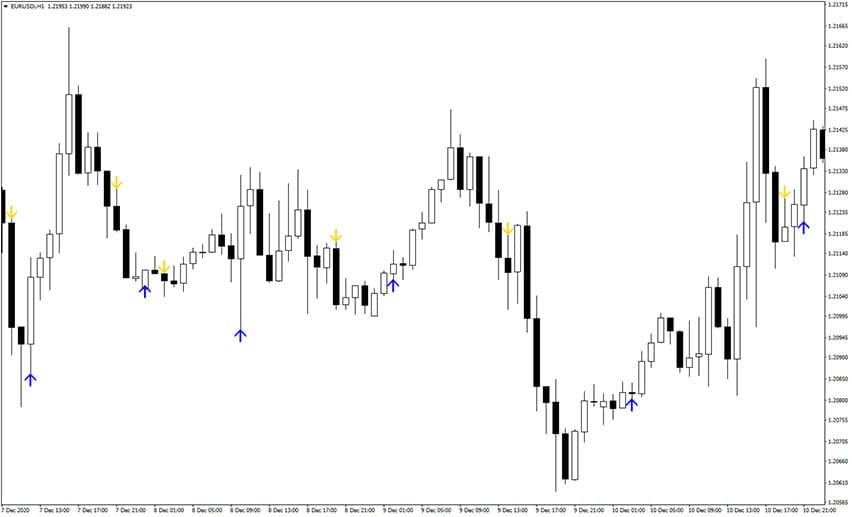
The MA Momentum Arrows indicator is based on the MA (Moving Average) applied to the Momentum indicator. It draws arrows at the confirmed crosses of the Momentum line over the MA line. When the Momentum crosses upwards, then a buy arrow is displayed and vice versa. The arrows do not repaint since the indicator only […]
TrendlessOS Histogram Indicator
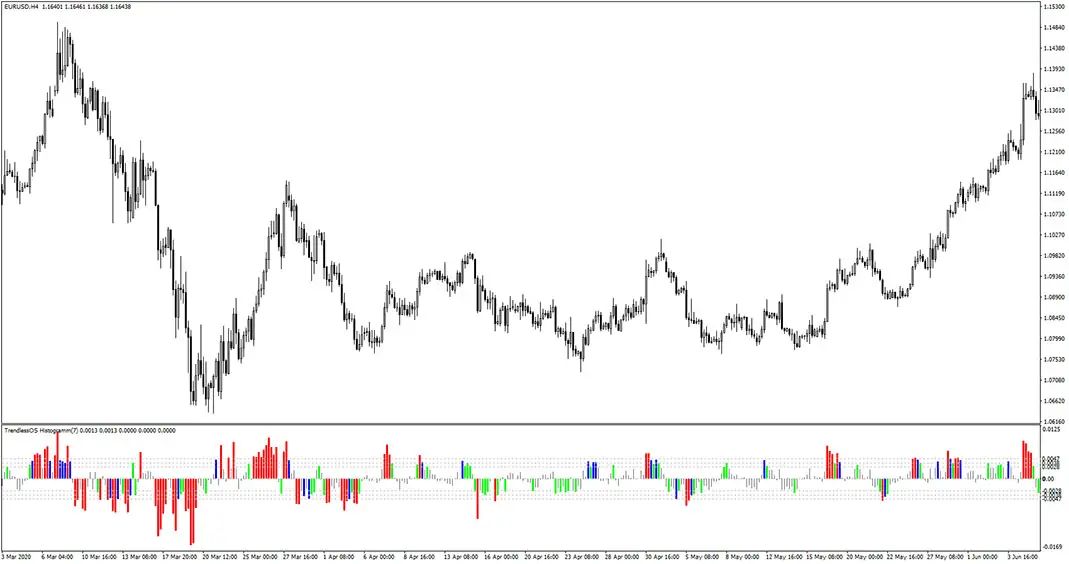
The TrendlessOS Histogram Indicator for MT4 provides gray and colorful readings based on price movements. When you see a green, red or blue bar exceeding the overbought or oversold level defined by dotted lines – it means a high-probality market reversal in underway. The best use case for this tool is combination with other technical […]
MACD Chart Points Indicator
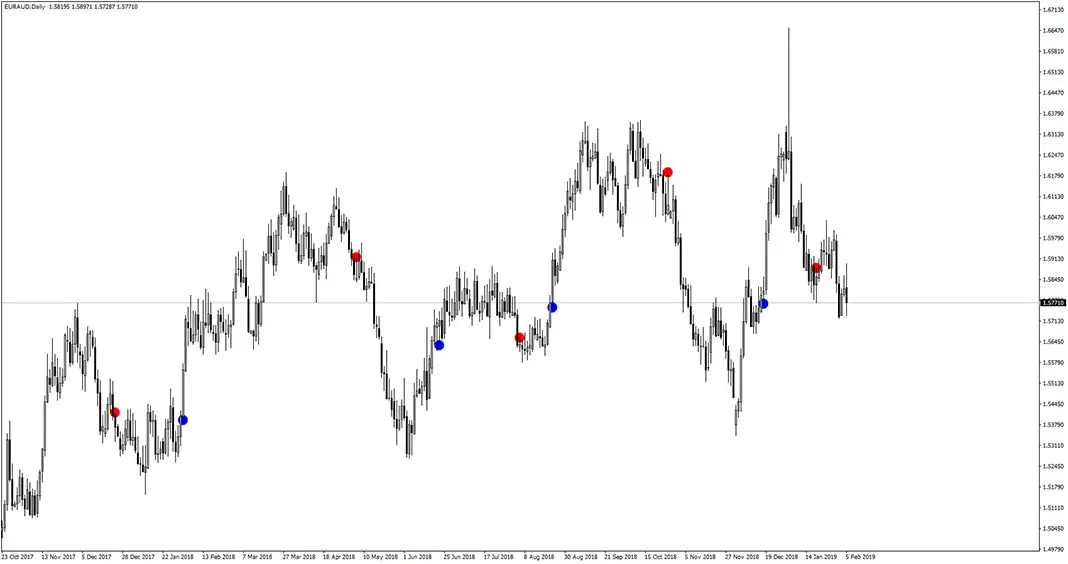
The MACD Chart Points is a simple forex gauge showing precise moments of switches between positive and negative MACD readings. These dots can be even used as entries. Nonetheless, this tool should be rather used in combination with other technical analysis indcators – e.g moving averages providing trend direction. EUR/GPY H1 Example Chart Supplying it […]
Next Move Indicator
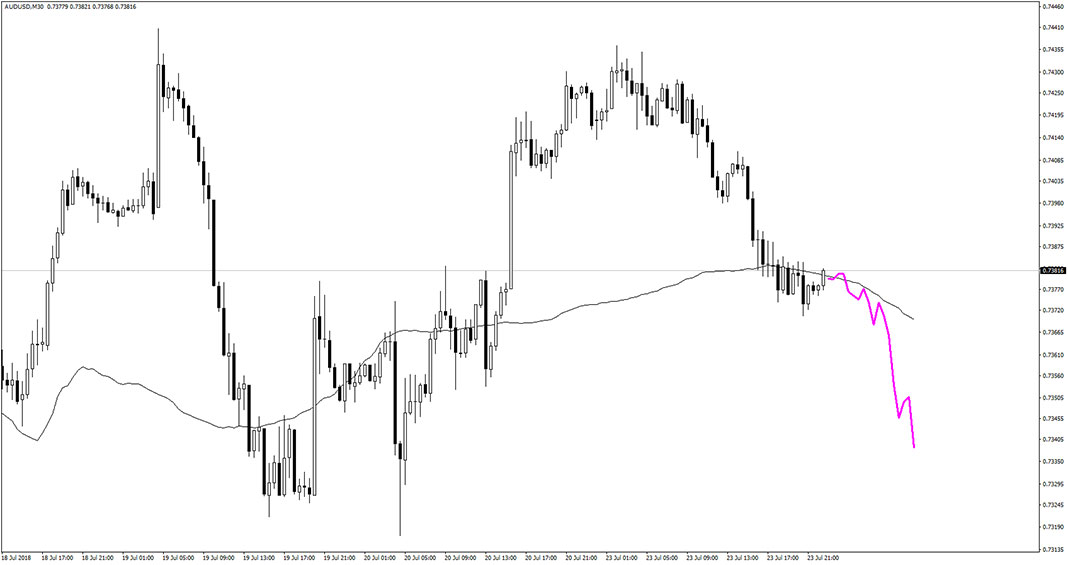
The Next Move Indicator is a custom forex tool that displays a prediction of price movement in the nearest future. The signals are shown in the form of a pink line. The indicator is displayed directly in the main trading chart and on the right side. We suggest to use it as a filter for […]
Ary Aind Indicator
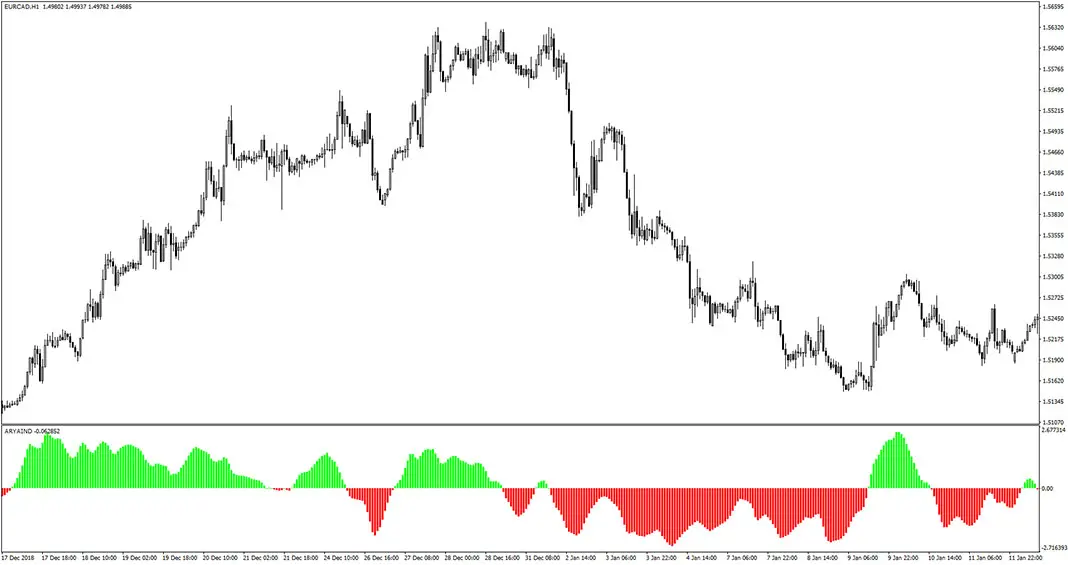
The Ary Aind Indicator acts and works in a similar manner to the Moving Average Convergence Divergence (MACD) indicator. The readings can be considered as momentum. As a rule of thumb, the green bars correspond to bullish setup and red bars reflect bearish scenario. Please note, that this indicator is repainting. Example chart:
Ehlers Fisher Transform MTF Indicator
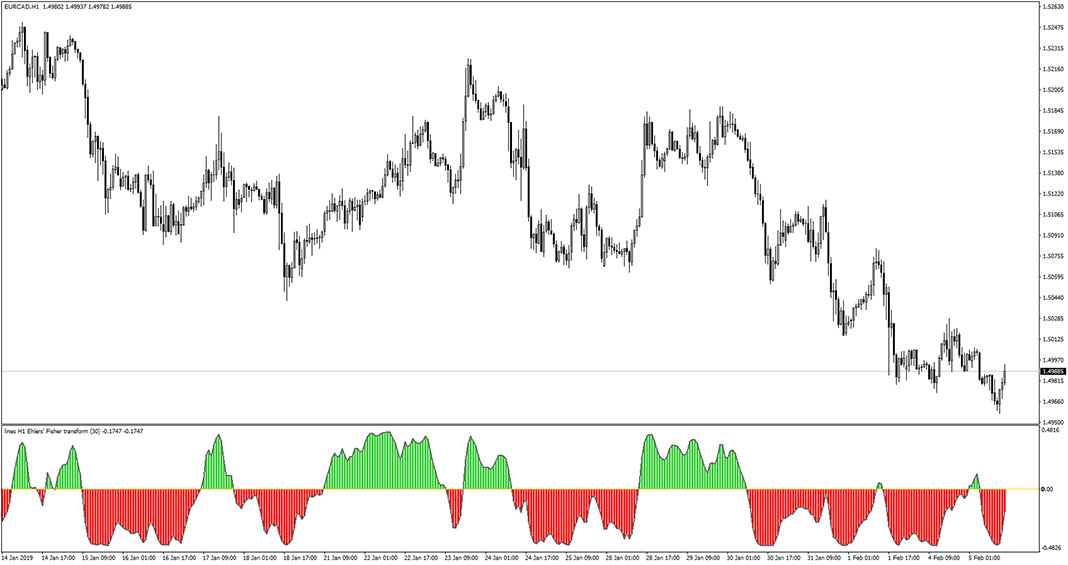
The Ehlers Fisher Transform MTF Indicator for MT4 is a popular tool for detecting ongoing market trends and also reversal points. The approach is pretty simple – green histogram bars correspond to bullish setup and red bars reflect bearish scenario. The moment when these readings switch is a trigger for potential and high-probabality reversal. Example […]
DMI Alert Indicator

The DMI Alert Indicator for MT4 is based on a Directional Movement Index, but it additionally displays buy/sell alerts. It consists of two lines: a red one and a green one. The red line above the green line indicates a bearish trend-momentum. Similarly, the green line above the red line suggests a bullish trend-momentum. Example […]