Category: Pattern Indicators
RSI Divergence Alert Indicator
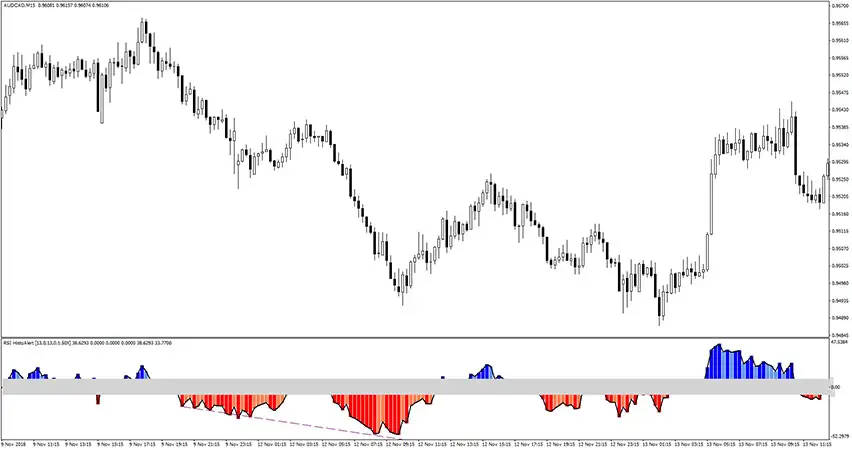
The RSI Divergence Alert Indicator is a custom variation of the Relative Strength Index indicator (RSI) that provides alerts when buy/sell signals occur. As the name suggests, these signals are based on the divergences between price and RSI indicator.
All In One Divergence Indicator
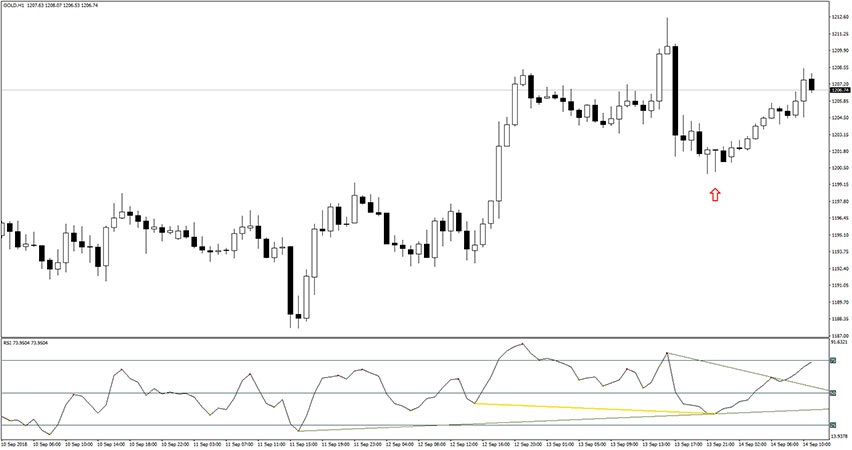
The All In One Divergence indicator for MT4 recognizes and marks divergences between price and the Relative Strength Index (RSI). There are two types of divergences: bullish (upward price move) and bearish (downward price move). It is pretty easy to follow the signals, simply follow these suggestions: In up trending market conditions, look for a […]
ZigZag WS Channel RV 2 Indicator
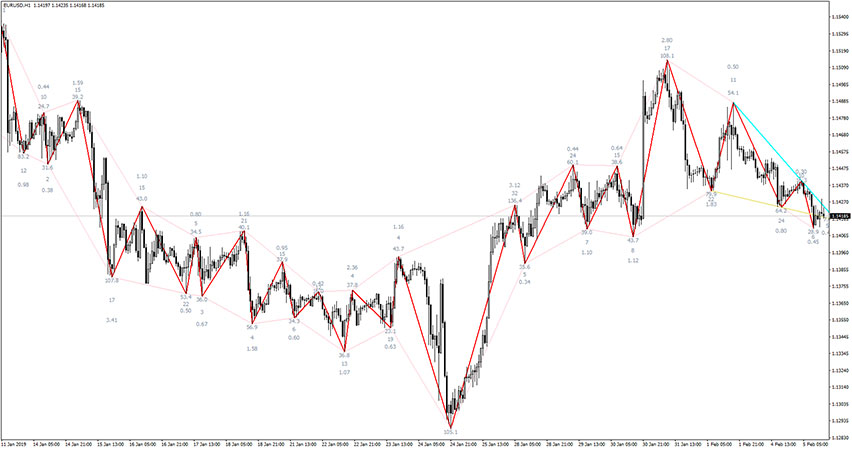
The ZigZag WS Channel RV 2 indicator highlights the swing points of the price. It connects the swing high and swing low points of the price that work as trendline support and resistance. With multiple trendlines, this indicator works as a trend-following price channel as well. Whenever the price intends to rebound from the trendline […]
RSIMA Baseline Divergence Arrows Indicator
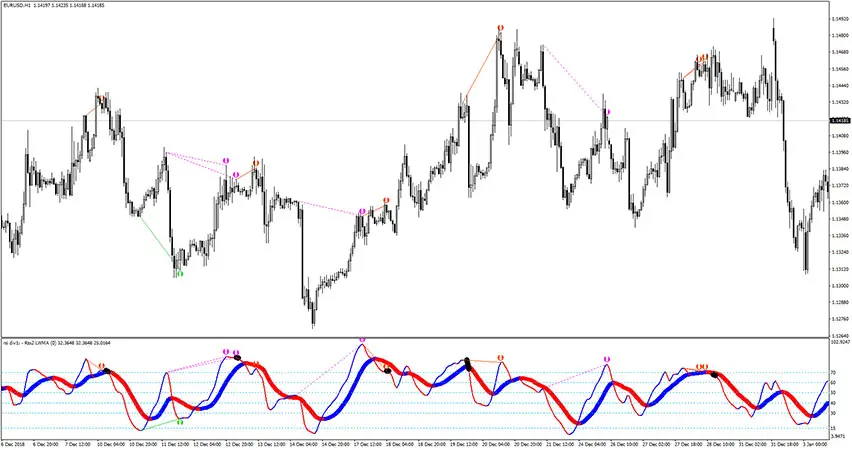
The RSIMA Baseline Divergence Arrows indicator works great at filtering those divergence signals. Divergences are only visible on this indicator if: If RSI MA is outside 80 Overbought, Bearish Divergence signal will appear (to forecast a reversal to the downside); If RSI MA is outside 20 Oversold, Bullish Divergence signal will appear (to forecast a […]
Pin Bar Buy Sell Indicator
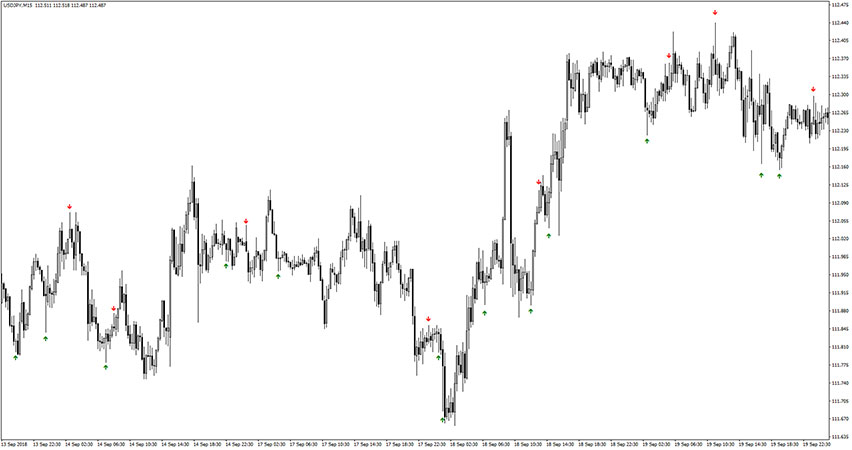
The Pin Bar Buy Sell indicator recognizes pin bar candlesticks and when the signal is generated it marks the triggering candles with buy/sell arrows.
Sibbet Demand Index Divergence Indicator
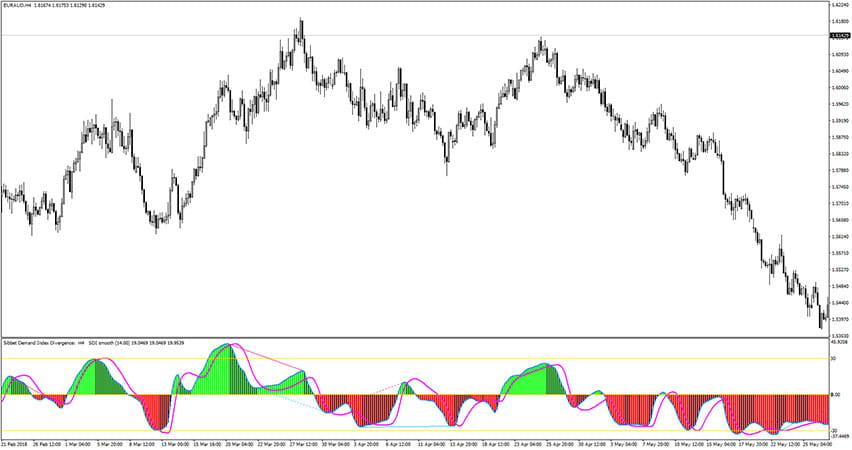
The Sibbet Demand Index Divergence indicator is a custom forex trading indicator that uses the moving average of the price data. It helps traders to understand whether the bullish or bearish movement in the price is getting stronger or weaker. That gauge is made of the histogram and the moving average (signal line). See also: […]
MACD Divergence Indicator
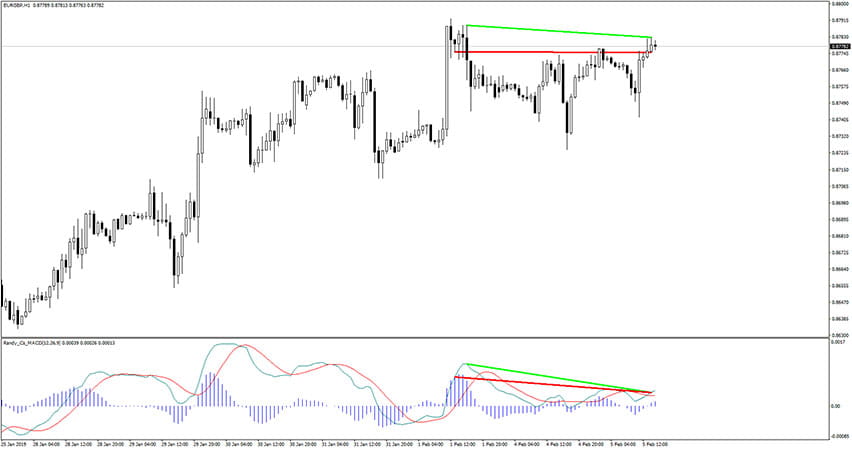
The MACD Divergence indicator is a forex trading tool based on the well-known Moving Average Convergence / Divergence indicator. It recognizes, spots, and displays divergences. Additionally, it will draw divergence lines. Reaction from these lines will be a good entry point. We give you 2 versions of MACD Divergence. The second one draws arrows after […]
MFI RSI Divergence Indicator
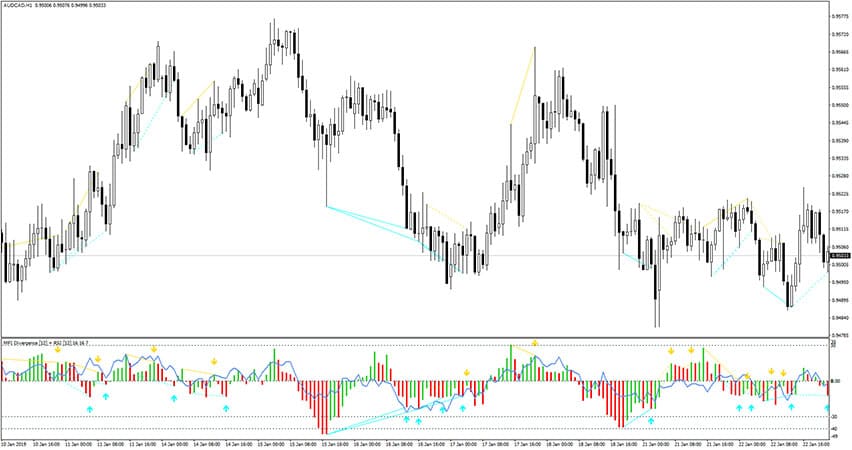
The MFI RSI Divergence indicator is a forex tool based on Money Flow Index and Relative Strenght Index. It recognizes, spots, and displays divergence. Additionally, it provides buy/sell arrows for bullish and bearish divergences. We suggest using it for entries and exit ideas or as a filter in your favorite trading strategy.
OBV Divergence Indicator
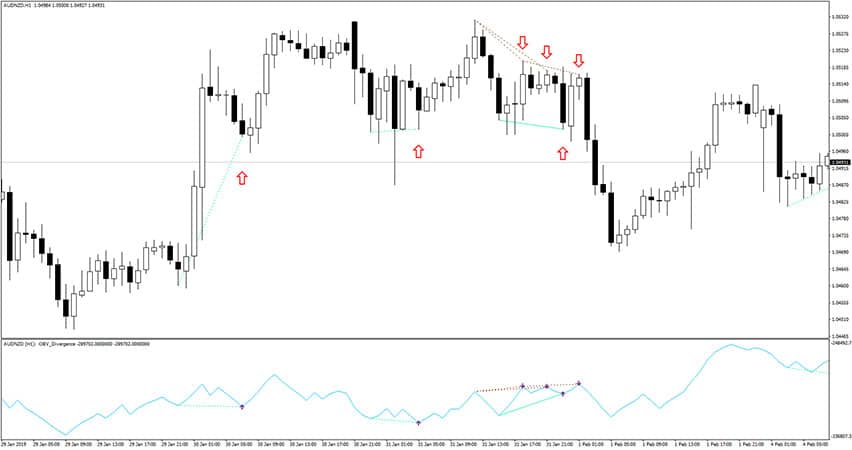
The OBV Divergence indicator is, as the name suggests, a forex trading tool that shows On Balance Volume divergences. When you load up the indicator into charts you should still adjust its settings. There are two options you will need to turn on. Set both the drawIndicatorsTrendlines and drawPriceTrendLines to true. Except that you will […]
Second Chart Indicator
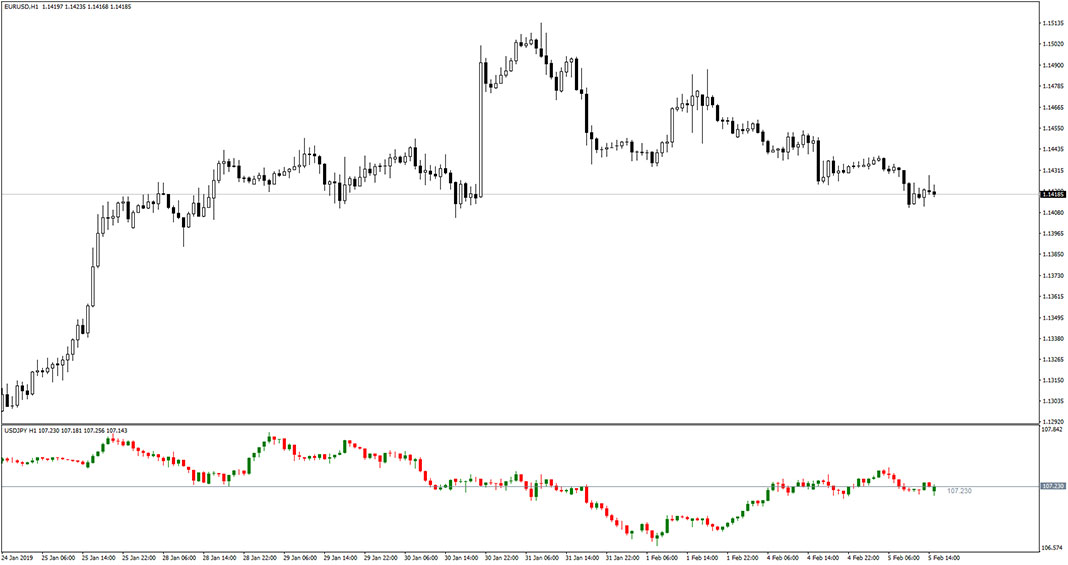
The Second Chart Indicator is a very useful tool that displays candles of chosen currency pair in a sub-window placed just below the main trading chart. It could be handy in various situations. For example, when you have many indicators plotted over candlesticks and you want to see the price action clearly. You can also […]