Category: Pattern Indicators
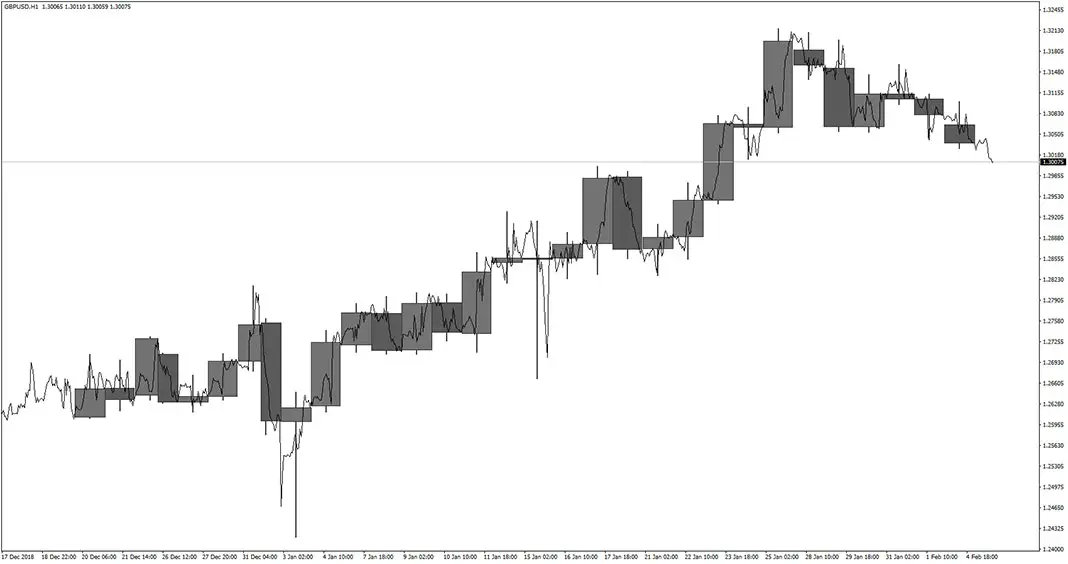
Three Line Break Indicator

The Three Line Break Indicator for MT4 is focused purely on price movements and do not consider the time factor. The starting point is about price action and trends, filtering smaller fluctuactions. In the result it’s easier for trades to identify significant changes. This method is named after the number of lines usually used to […]
M-Candles Indicator
The M-Candles Indicator for MT4 is a simple but useful tool that displays bigger time frame candles in your current TF chart. By default, it is set to show daily candles on an hourly chart. You can use it for spotting accurate trade entries and exits when using technical analysis of higher timeframes. Example chart:
Bigger TF OHLC Indicator
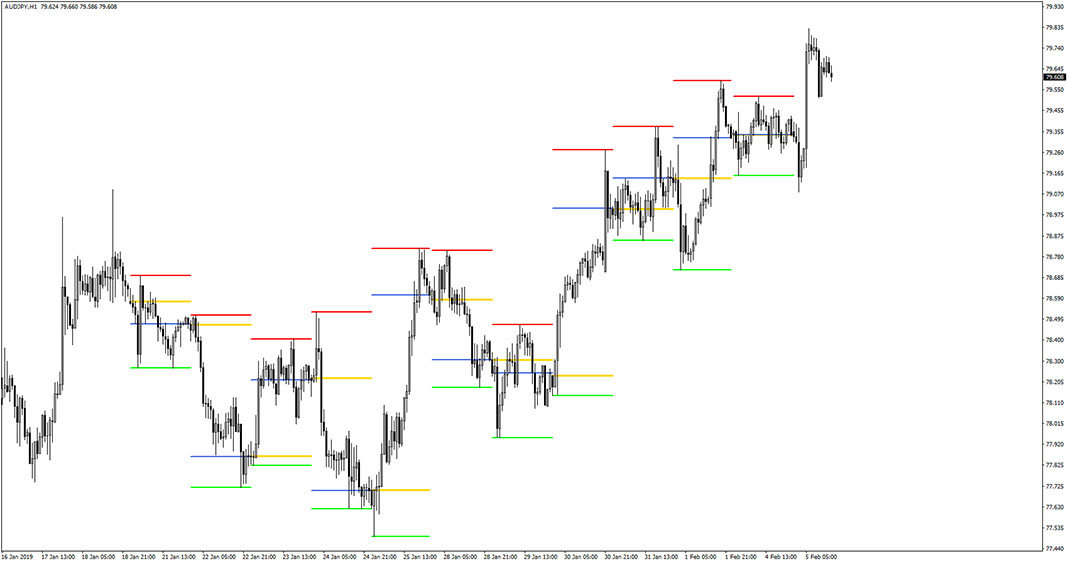
The Bigger TF OHLC Indicator for MT4 is responsible for showing open, high, low, close levels of the selected higher timeframe. For example, you can preview these values of D1 (daily) chart while having M15 activated. One can think about the readings in terms of support and resistance as price often respects them, therefore range […]
Bigger TF Candles Week Day Indicator
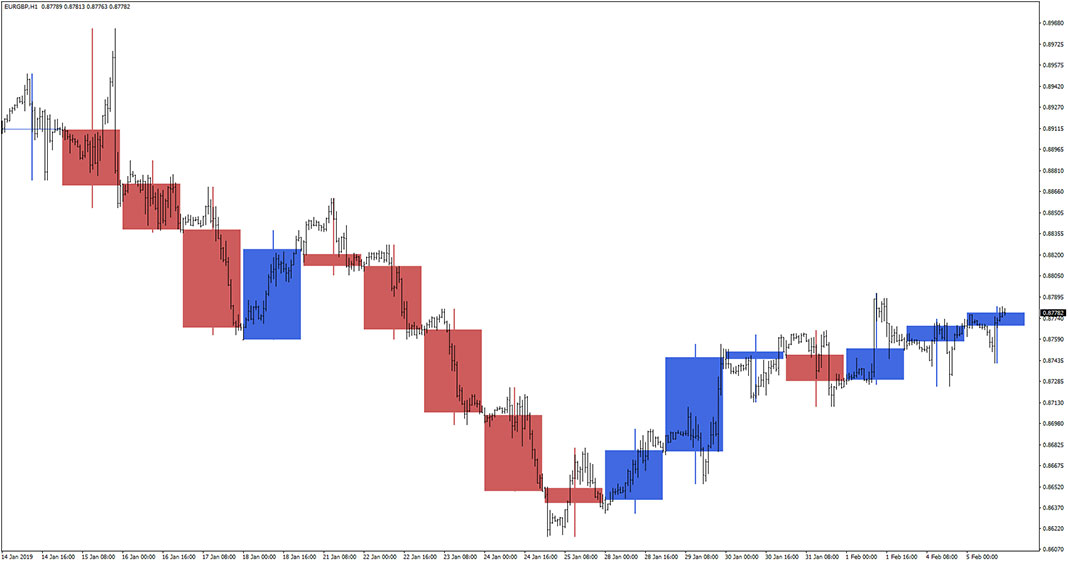
The Bigger TF Candles Week Day Indicator for MT4 overlays candlesticks from a chosen higher time frame directly onto your current chart. For instance, let’s say you the H1 active and this indicator will place bars from daily. It’s a great way to see how price action of 24 candles constitutes one daily bar. This […]
WMI for V3 Indicator

The WMI for V3 Indicator for MT4 is responsible for making projections regarding upcoming price movements. Yes, you can preview the exact candlesticks likely to occur in the nearest future. What’s more, it also provides take profit targets – you can see the signal and values in the top right corner of the screen. Example […]
Bheurekso Pattern Indicator

If you are a pattern trader you should definitely try the Bheurekso Pattern Indicator. This MT4 gauge automatically scan charts in order to recognize and mark various candlestick patterns. Let’s examine it in more details. How to take advantage of the Bheurekso Pattern? The japanese candlesticks tell a lot about about price action and market […]
New Heiken Ashi Indicator
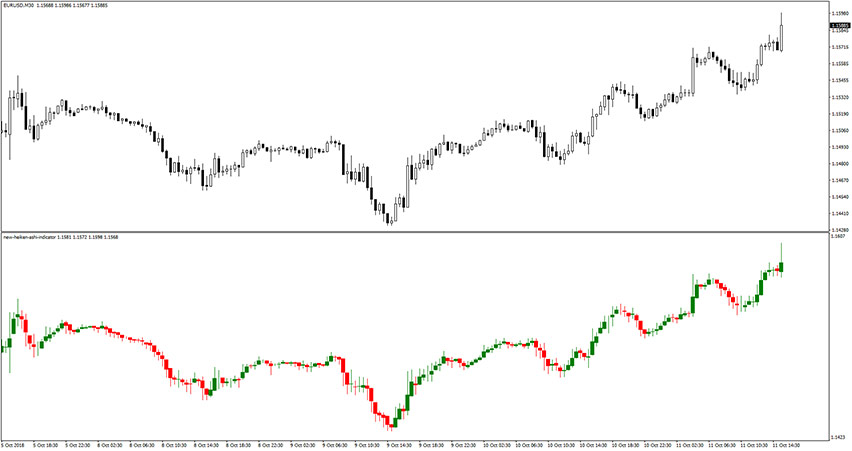
The New Heiken Ashi Indicator for MT4 displays an alternative way for price charting. Simply speaking, it provides an additional window with Heiken Ashi candlesticks, while keeping original Japanese candlesticks above it. That way you can compare both types of charts. See an example:
CCI Custom Candles Indicator

The CCI Custom Candles Indicator for MT4 displays colorful candles directly on the trading chart. It simply puts an overlay over the regular bars (not all of them) reflecting the readings from the Commodity Channel Index. This form of display is friendly and provides quick signal recognition. Green color represents bullish readings and red reflects […]
Forex Candle Predictor Indicator
The Forex Candle Predictor Indicator for MT4 is an extraordinary forex trading tool that has the ability to accurately forecast upcoming candlesticks automatically. It simply draws the next potential candles directly on charts. It’s definitely one of the most unique gauges. The prediction is directly plotted on the chart as the bluish candles are the […]
Regular RSI Divergence Indicator

The Regular RSI Divergence Indicator for MT4 displays its signals in the form of histogram bars, which is pretty unusual for this type of gauge. Nonetheless, green bars indicate a bullish momentum, and similarly, red bars reflect bearish momentum. Of course, traders can utilize the divergences too, even there is different form of the provided […]