Category: Oscillator Indicators
Vortex Oscillator Indicator MT5
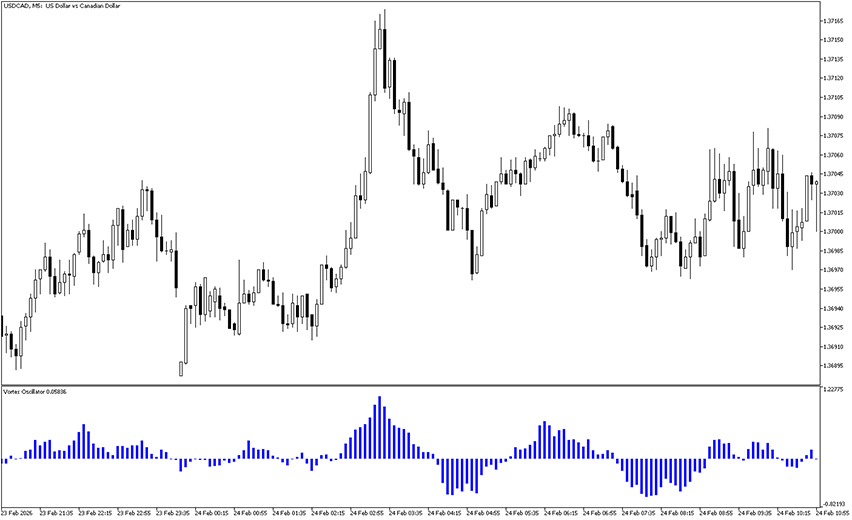
The Vortex Oscillator Indicator for MT5 displays histogram bars and can be successfully used both in trend-following and reversal strategies. Example chart: How to use the Vortex Oscillator Indicator for MT5? This oscillator is based on the original Vortex indicator and shows the difference between the VI+ and VI- lines as a histogram. Blue bars […]
MT5 Rainbow Oscillator Indicator
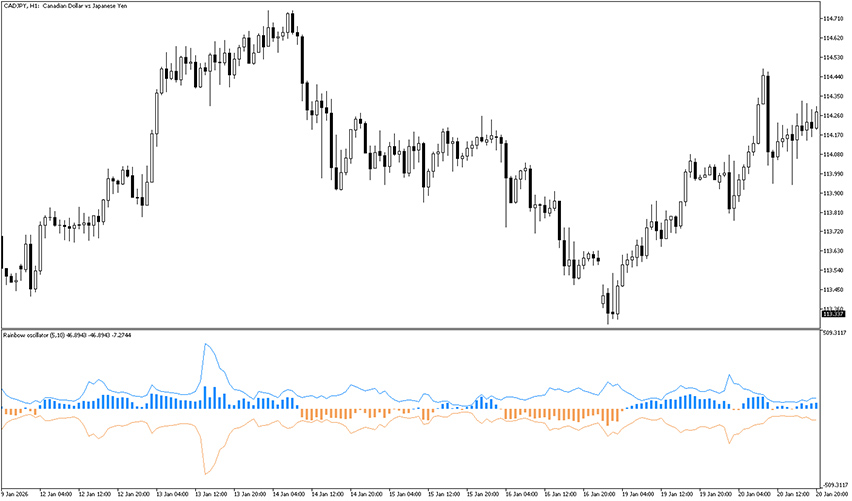
The Rainbow Oscillator Indicator for MT5 is based on the Mel Widner’s Rainbow Average, but this version displays both histogram bars and oscillator line. Example chart: How to use the MT5 Rainbow Oscillator Indicator? The goal of the Rainbow Oscillator Indicator for MetaTrader 5 is recognizing and showing trends in the market. Blue color corresponds […]
MT5 Kairi Relative Index Indicator

The Kairi Relative Index Indicator for MT5 analyzes price movements and helps traders spot exhaustion and pullback opportunities. Behind the scenes, it calculates how far price has stretched away from moving average and displays dedicated oscillator line. Example chart: How to use the Kairi Relative Index Indicator for MT5? The Kairi Indicator measures how far […]
Entropy Math Indicator MT5

The Entropy Math Indicator for MT5 is one of a kind oscillator designed to recognize hidden patterns in seemingly chaotic market movements. This tool measures randomness (entropy) in price action in order to to detect and provide high-probability trading signals. Example chart: Entropy is able to identify hidden market patterns Let’s face the truth – […]
Buy Sell Pressure Indicator MT5

The Buy Sell Pressure Indicator for MT5 is designed to measure momentum by analyzing the balance between buying and selling pressure in the market. While it may appear simple at first glance, this indicator delivers meaningful insights that go beyond standard oscillators. Example chart: How to use the buy sell pressure indicator for mt5? After […]
Double Stochastic With RSI Indicator
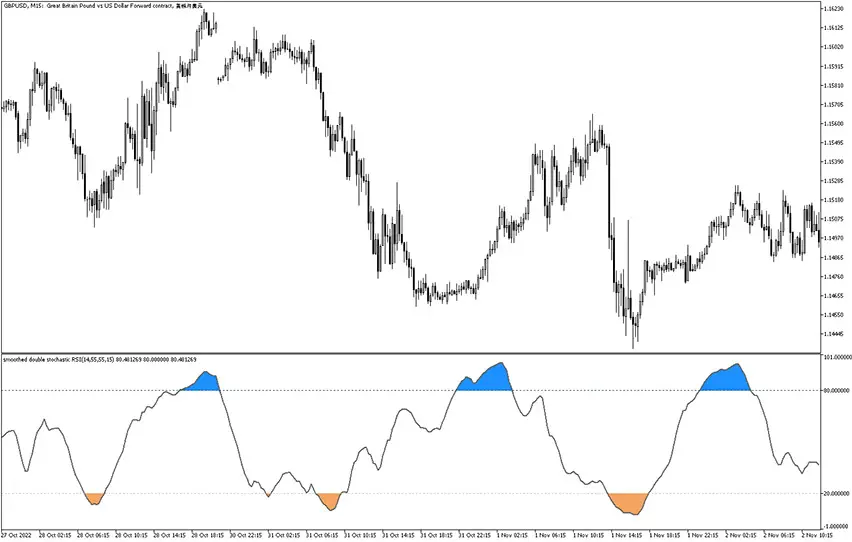
The Double Stochastic With RSI Indicator for MT5 is an interesting combination of these two popular oscillators that are by many considered the best reversal gauges. Its main principle is comparing previous and current values of the readings. The final calculations are pleasantly displayed on the charts with clear overbought and oversold areas. The idea […]
Stochastic Cross Alert Indicator
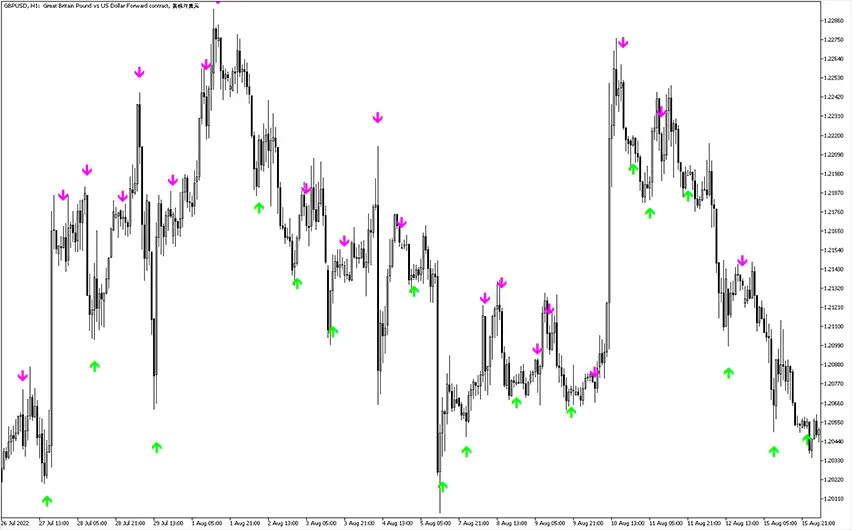
The Stochastic Cross Alert Indicator for MT5 is a technical trading tool that simply utilizes crossovers of signal lines from the renowned Stochastic gauge. It conveniently displays buy and sell arrows directly on the price chart for immediate visual reference. This user-friendly approach ensures that trader with any level of exeprience can quickly reap its […]
Keltner Channel Oscillator Indicator
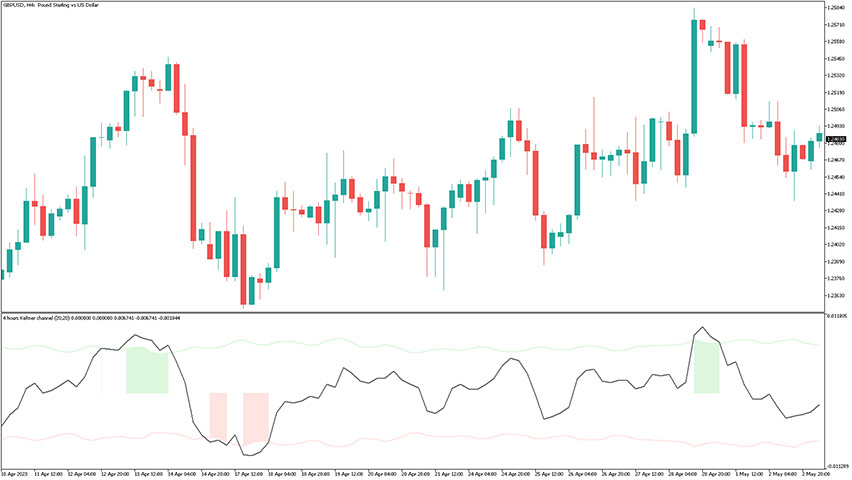
The Keltner Channel Oscillator Indicator for MT5 is a revised verison of this popular gauge but this one is dedicated specially for recognition of channel breakouts. It simplifies the process and provides easy visual clues for this particular setup. Other than that, it’s basically the vary same tool, but let’s analyze it more details. This […]
Blau Directional Trend Index Indicator
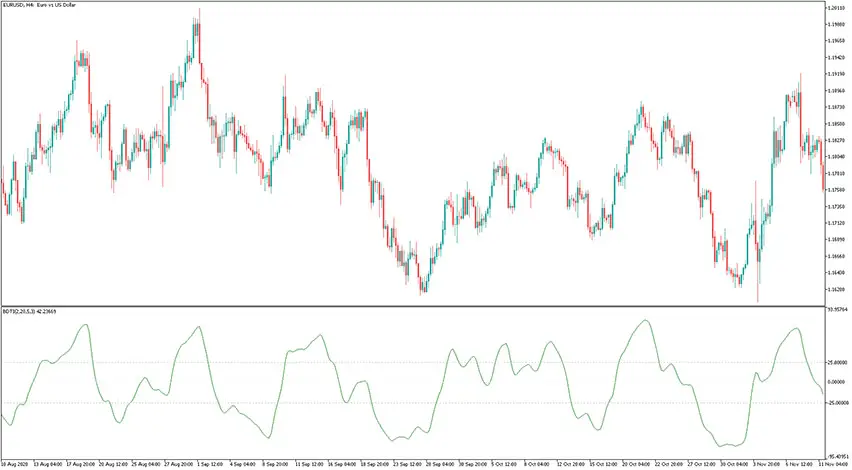
The Blau Directional Trend Index Indicator is based on the technique first introduced by William Blau in his book “Momentum, Direction and Divergence” (1995). The author focuses on three key aspects of trading: momentum, direction and divergence. The Directional Trend Index is an indicator that works in a similar manner to the DM+, which is […]
Stochastic of Hull Average Indicator

The Stochastic of Hull Average Indicator is, as the name suggests, a combination of Stochastic Oscillator and Hull indicator. The Hull period is set to 32, and the Stochastic period is also set to 32. As you can see, the signal line is either blue or pink. A blue line indicates bullish trend-momentum, and conversely, […]