Keltner Channel Oscillator Indicator
Platform: MT5 Type: Oscillator Last update: October 18, 2024The Keltner Channel Oscillator Indicator for MT5 is a revised verison of this popular gauge but this one is dedicated specially for recognition of channel breakouts. It simplifies the process and provides easy visual clues for this particular setup. Other than that, it’s basically the vary same tool, but let’s analyze it more details.
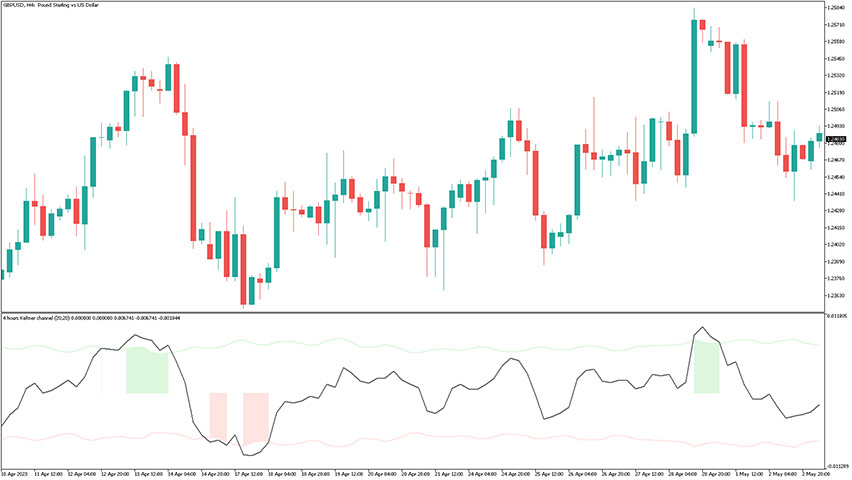
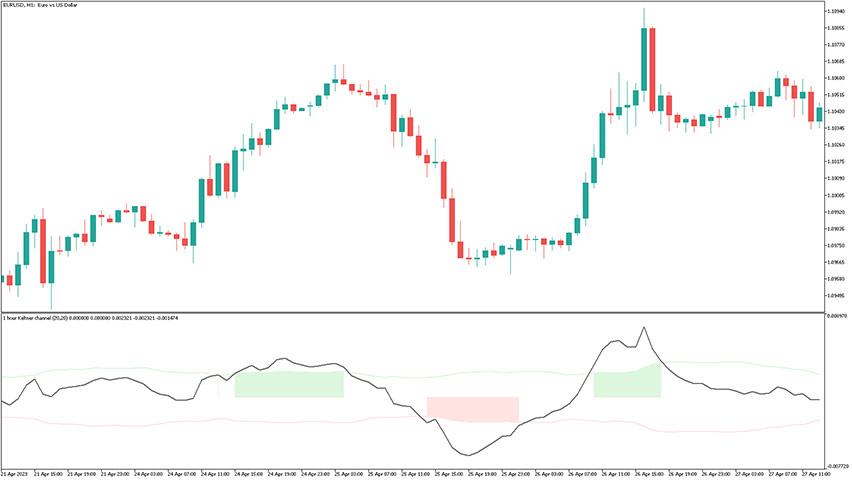
This is an example chart, upon activation in MetaTrader 5 platform.
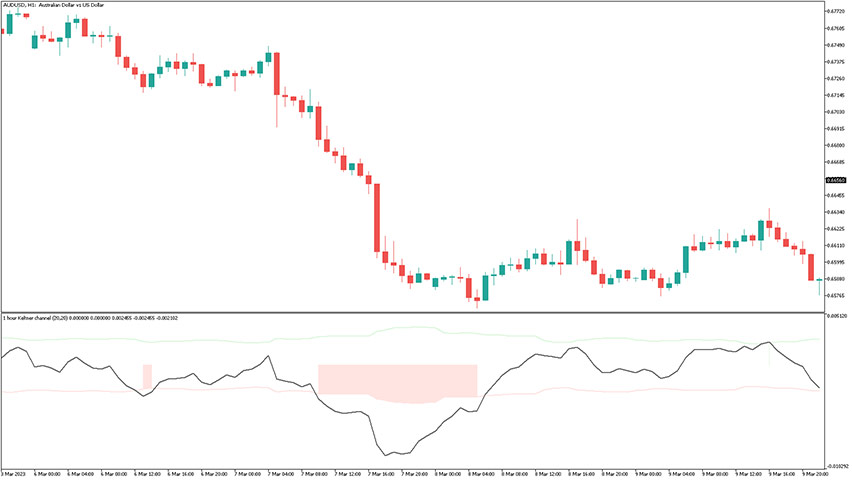
As you can see, unlike the traditional editon, this one displays signals in a seperate window placed below the main trading chart. The main difference is that this indicator functions as an oscillator – you can see the dark fluctuating line. Beside it, there are two parallel bands and colorful highlighted areas.
Explaining the keltner channel oscillator
The idea for trading being applied is all about utilizing price extremes. Once such setup is in place, there very high probability of market reversal. When the main signal line drops below the lower band, you will notice pinkish zone painted. Similarly, when it raises beyond the upper band, a greenish zone will be plotted.
Obviously in bearish movement look for long opportunity and conversely in a bullish momentum look for a short trade. It doesn’t provide an exact entry points, however you can use price action analysis or onboard any additional technical indicator of your choice.
This chart shows how the price retraces each time after achieving overbought and oversold state.
Conclusion
This is pretty solid indicator with a good success rate of provided signals. Nonetheless, one need to accout that, statistically more rare but still, there are periods of strong and longer lasting trends when price won’t really pullback that much. Yet, most of the time it will be fine especially when introduced accurate entry provider.
Submit your review | |