Fiji BB Alert Indicator MT4
Platform: MT4 Type: Channel Last update: August 25, 2026The Fiji BB Alert Indicator for MT4 plots a price channel with a central moving average line. Then adds automatic buy and sell alerts, marked as dots on the chart whenever the trend shifts.
Example chart:

How to use the Fiji BB Alert Indicator for MT4?
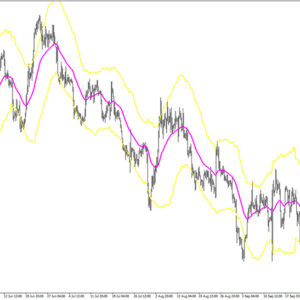
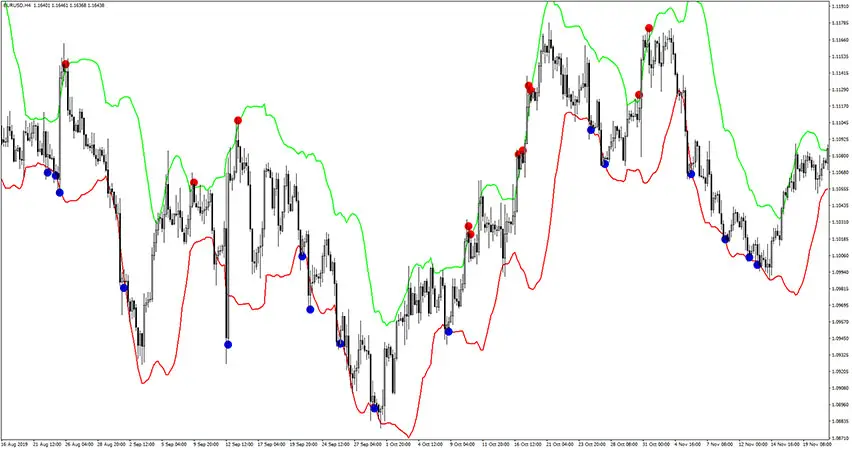
The Fiji BB Alert Indicator for MT4 displays an green band, a red band and a dotted central line running between them.
One can consider this is a Bollinger Bands variation.
There is the dot system layered on top:
- A red dot marks a sell signal near the upper band
- A blue dot marks a buy signal near the lower band.
Price interaction with the bands is what drives these signals.
When price pushes toward the upper band, it often means the current uptrend is running out of steam. In this situation, it may be worth closing long positions and watching for a short opportunity, marked by a red dot.
When price drops toward the lower band, the reverse applies: a downtrend may be nearing exhaustion, favoring an exit from shorts and a possible long entry, marked by a blue dot.
If price stays near the central moving average, that generally reflects a low-momentum market. It means neither side has clear control.

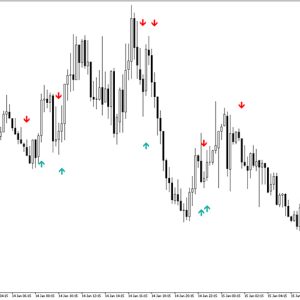
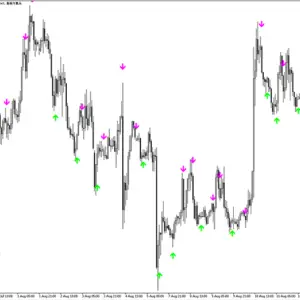
As you can see on the EUR/AUD H1 chart above, red dots line up with local tops near the green band. Blue dots line up with local bottoms near the red band. This gives a clear visual read on momentum shifts.
The Fiji BB Alert Indicator works across all timeframes. Lower timeframes fire more signals, but carry a higher chance of being false.
Settings
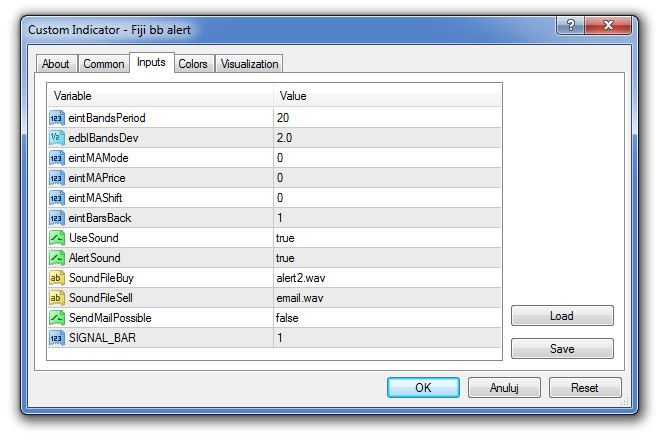
These are available settings.