Fractal Support and Resistance Levels Indicator
Platform: MT4 Type: Market Levels Last update: January 2, 2025The Fractal Support and Resistance Levels Indicator for MT4 defines areas of strong support and resistance barriers. They can be used in reveresal trading as well as in breakout opportunities. As the name suggests, it’s also based on fractals, which means that provided signals are based on high low prices of various periods. When used properly it has potential to bring really good results.
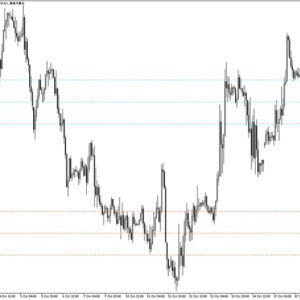
Example chart:

How to trade using the fractal support resistance levels in metatrader 4?
It accounts levels of MN1, W1, D1, H4 timeframes which are represented in the following way:
- monthly is solid dark red line
- weekly is solid light red line
- daily is solid orange line
- four hours is dotted yellow line
In order to make the most of this indicator, one should have a strong knowledge and solid understanding of price action patterns. Every time the price approaches any of these horizontal lines, there are only two possible scenarios: either a breakout occurs, or the level is rejected and then price reverses.
To accurately interpret these movements, it is essential to recognize reversal patterns (such as pin bars) or continuation patterns (like flags or pennants).
This strategy gives very good risk to reward ratio and even if a trade is not successful, the loss is minimal.
Submit your review | |