MACD Histogram Indicator MT5
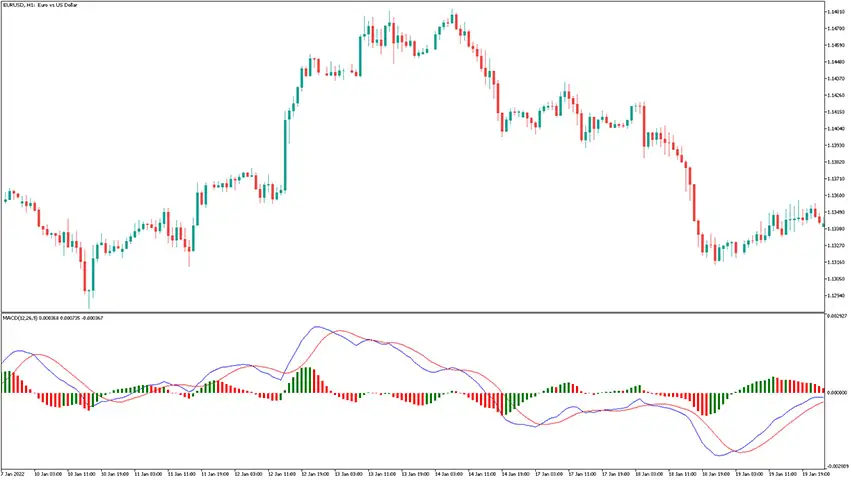
Platform: MT5 Type: Momentum Last update: July 19, 2025The MACD Histogram Indicator for MT5 is responsible for showing the difference between the MACD line and signal line. Additionally, the histogram bars make it easy to see when bulls or bears are gaining control of the market.
How to use the macd histogram indicator for mt5?
A quick glance of an eye is enough to notice that it displays frequent moving averages crossovers. This is a practical intersection of slow and fast MA. Hence, this might be an interesting choice for forex traders utilizing crossovers in their technical analysis.
These trading signals are pretty easy to understand so both beginners and advanced forex traders have a high chance of profitable outcomes. It’s worth to note that the readings of the macd histogram indicator are quite versatile and can be successfully applied by scalpers, day traders and swing traders.
How to interpret colorful histogram bars?
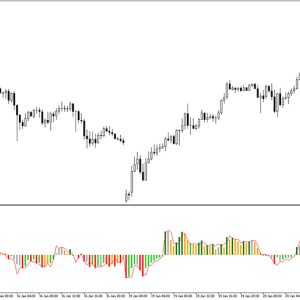
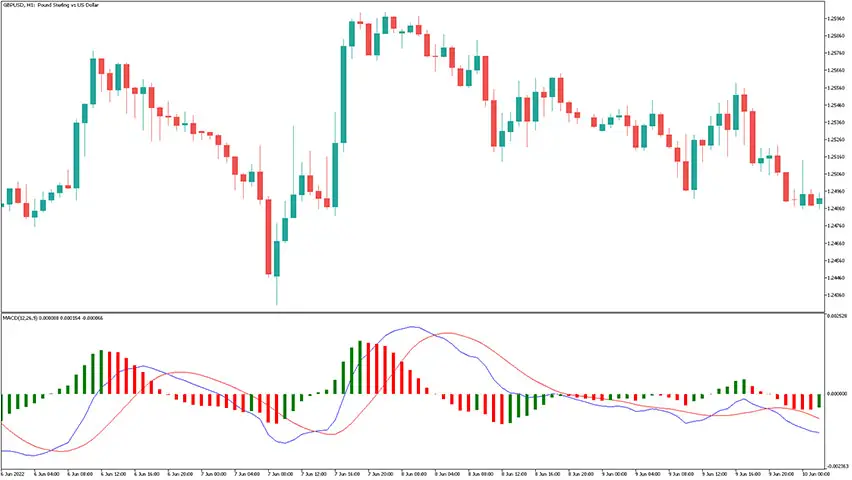
The idea behind this strategy is to use colors of histogram bars, or being more specific, to utilize the very moment of these color changes.
For bullish scenario: bars should change from red to green indicating a start of potential uptrend momentum. Traders may consider opening a long trade with a stop loss set few pips below the recent low of the price.
For bearish scenario: bars should change from green to red indicating a start of potential downtrend momentum. Traders may consider opening a short trade with a stop loss set few pips above the recent high of the price.
When it comes to profit taking, there are no direct signals for this purpose, but we have couple of suggestions.
First, one may close the trade at the arrival of opposite trading signal, however such simple approach may result in frequent fake or premature exits. Another idea is to use the MACD histogram with another technical indicator, both for confirmation of entries and exits.
Combining it with other technical analysis tools
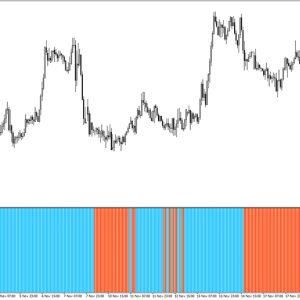
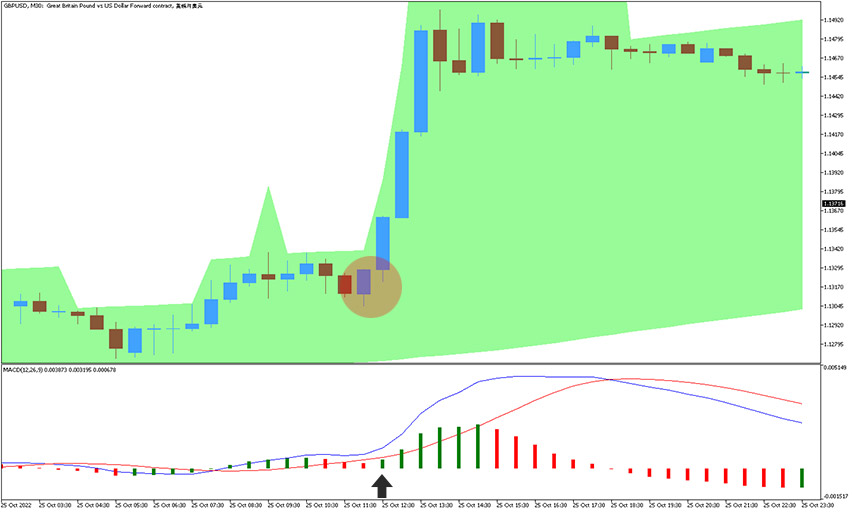
MACD Histogram with Karpenko Cloud
The Karpenko indicator displays a green/red cloud which acts as trend direction filter. Therefore, when histogram changes to green, color of cloud should be aligned too as a confirmation of entry. You can close a trade when the cloud becomes more narrow.
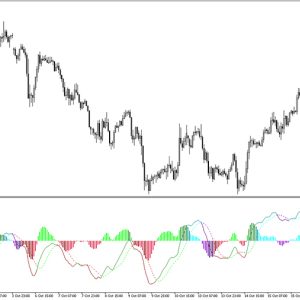
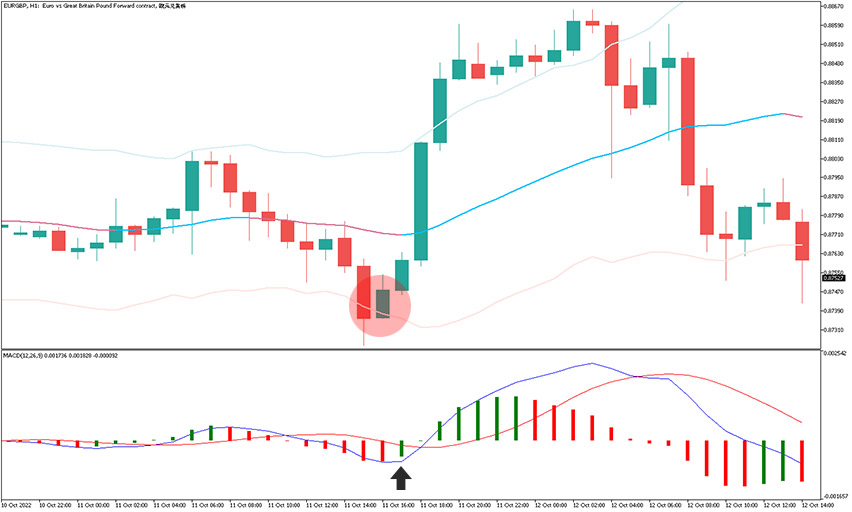
MACD Histogram with Keltner Channel
This concept involves trading within the channel and it’s most effective during sideways market.
When price touches the lower band and MACD bars becomes green – this defines a bullish setup. First take profit level is at the middle line of the channel and second take profit target is the upper band. Conversely, for a bearish setup – price needs to touch the upper band and histogram needs to turn red. Exit levels are analogous, but at the opposite band.
Indicator settings
For the calculation of the MACD line, one can choose from the usual price types.
For the calculation of the signal line, one can choose between a Simple Moving Average or an Exponential Moving Average.
The histogram can be switched between single and multi-color.
Conclusion
The MACD Histogram Indicator for MT5 is perfect tool for analyzing forex market momentum. Traders can successfully use it autonomously or build a custom system when it’s applied in conjuction with other technical tools.
Submit your review | |