Power Trend Indicator MT4
MT4 Free DownloadIntroduction to the Power Trend Indicator
The Power Trend Indicator has an interesting ability to measure market trends and provides a visual display of their various stages. That gauge tells a trader what is the trend direction and its strength.
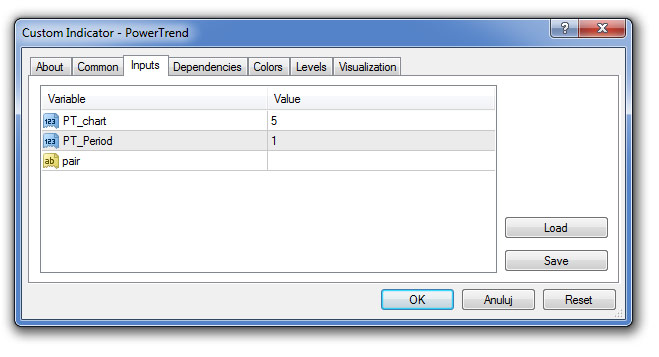
The Power Trend Indicator fits all kinds of timeframes and currency pairs. It is displayed in a separate window placed just below the main trading chart. The default settings can be modified directly from the input tab. Feel free to experiment with the settings and parameters to fit your personal preferences.
Closer look on the Power Trend Indicator
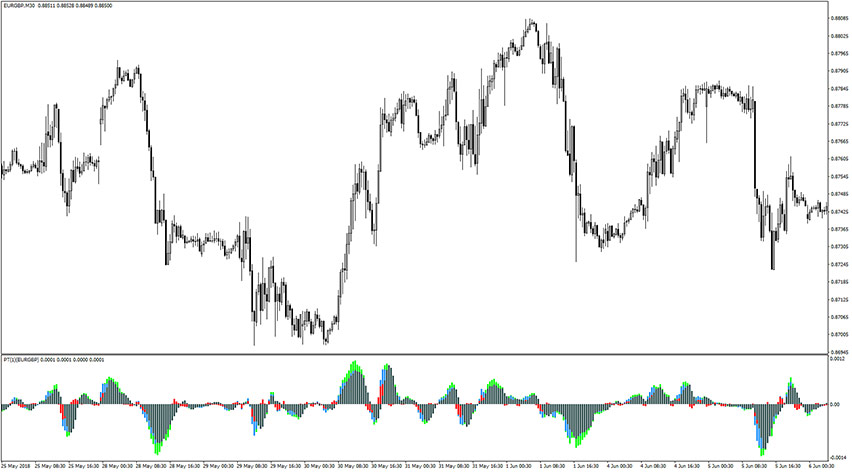
When you first load the Power Trend Indicator you will notice that it consists of colorful bars that are either rising above the 0 level or falling below the 0 level. Each color has a meaning as it determines the presence of a trend, direction, and strength. In other words, it’s able to show the possible emergence of a new trend, and determine if the trend strength is low, moderate or strong.
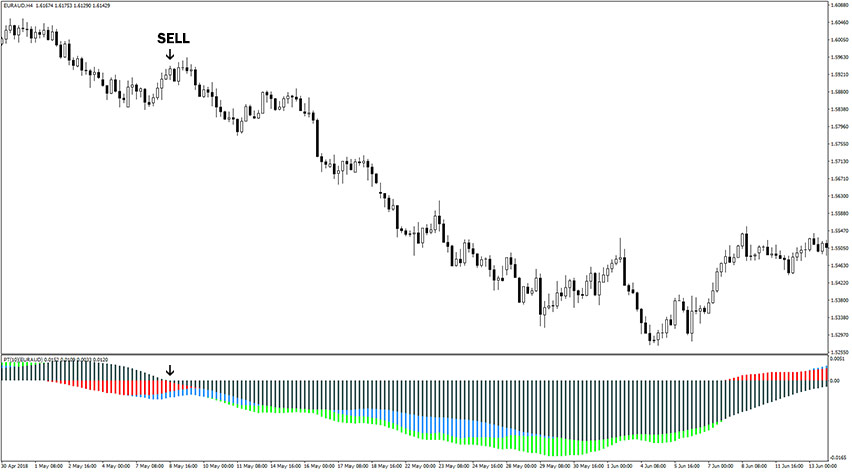
What’s more these colorful bars can overlap each other, depending on the stage of the trend. Take a look on the example chart.
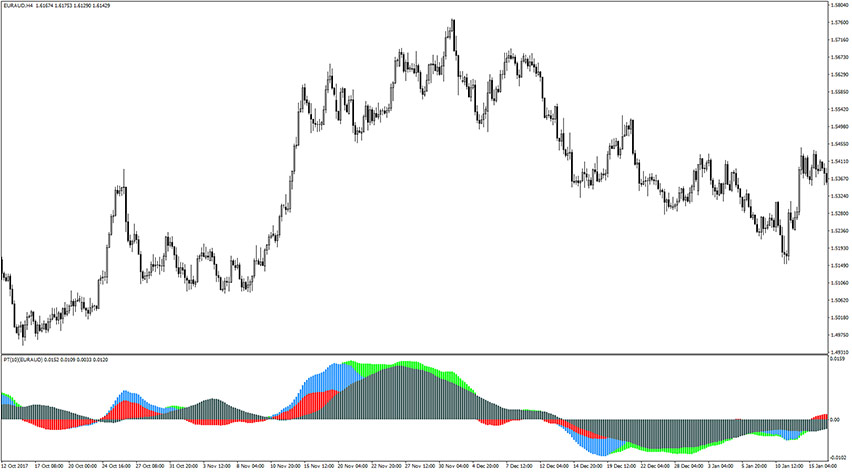
Default settings of this indicator are rather suitable for scalping and in our opinion give too many signals (a lot of noise). In the examples below, we changed the value of option PT_Period from 1 to 10. In a result, we get fewer signals, more quality, and for medium to long-term horizon, so suitable for swing trading.
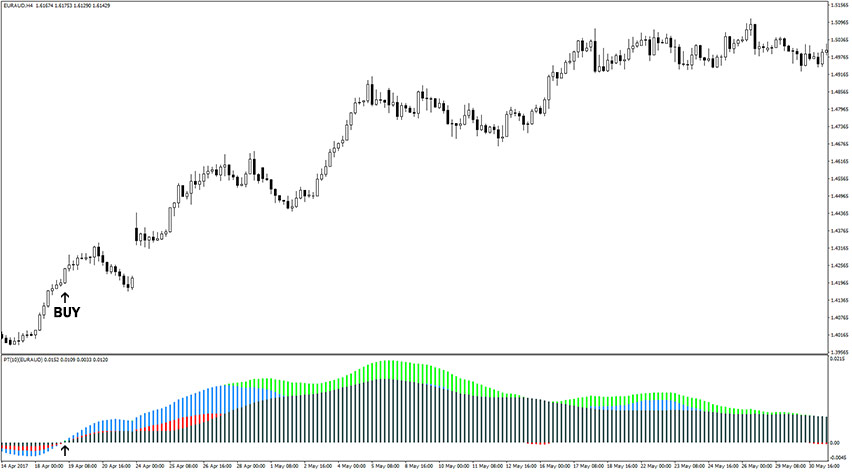
Buy Signal
The direction of the trend is changed to upwards when the bars switch form negative to positive (above 0 level). This is an early sign of the new bullish trend emerging. Appearing of the blue color bars means that the strend is getting stronger. The green bars suggest the strend is in advanced stage. The red bars indicate that there are some minor forces in the opposite direction.
Sell Signal
The direction of the trend is changed to downwards when the bars switch form positive to negative (below 0 level). This is an early sign of the new bearish trend emerging. Appearing of the blue color bars means that the strend is getting stronger. The green bars suggest the strend is in advanced stage. The red bars indicate that there are some minor forces in the opposite direction.
How to set up the Power Trend indicator in MetaTrader (MT4)?
Installation Guide
Download the Power Trend.rar archive at the bottom of this post, unpack it, then copy and paste the Power Trend.ex4 or Power Trend.mq4 indicator files into the MQL4 folder of the Metatrader 4 trading platform.
You can gain access to this folder by clicking the top menu options, which goes as follows:
File > Open Data Folder > MQL4 > Indicators (paste here).
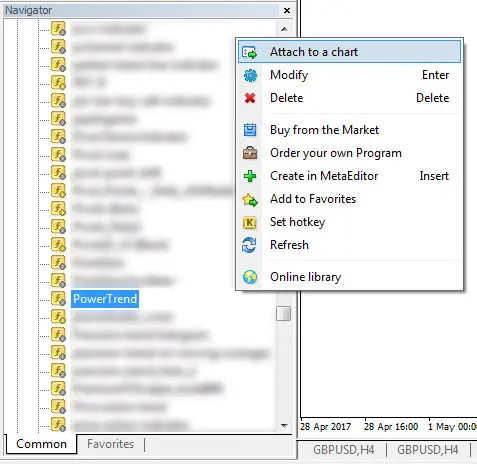
Now go to the left side of your MT4 terminal. In the Navigator find the gauge name, right-click it and select Attach to the chart.
Summary Of That Forex Indicator
The Power Trend indicator is well worth adding to your trading collection. A good forex indicator will most probably enhance your chance of success. Nonetheless, remember about having realistic expectations. Just like any other technical analysis tool, is not capable of providing accurate signals 100% of the time. Thus, this forex indicator provides false signals occasionally. Its performance will vary significantly depending on market conditions. Feel free to develop your own trading system based around it. Don’t forget that we still have more great free forex MT4 indicators to download and try.
Download Free Forex MT4 Power Trend Indicator
To download the Power Trend Indicator for Metatrader 4 (MT4) for free just click the button below:
Power Trend Indicator Free Download
